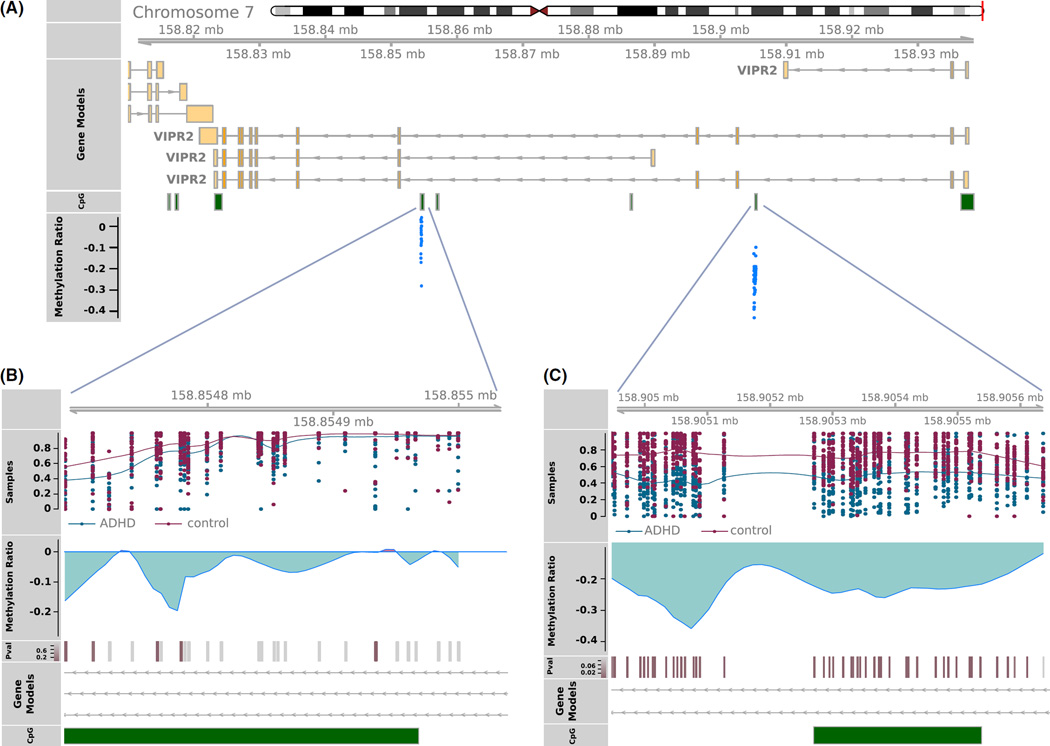
Figure 2.
VIPR2 Targeted bisulfate sequence validation. (Panel A) VIPR2 gene models indicating the genomic locations for the probes targeted for validation. All probes were located in two CpG islands shown in green. (Panel B and C) Individual sample methylation ratios for ADHD (red) and control (blue) specimens. p-Values for differential methylation between ADHD and controls is shown per CpG tested

