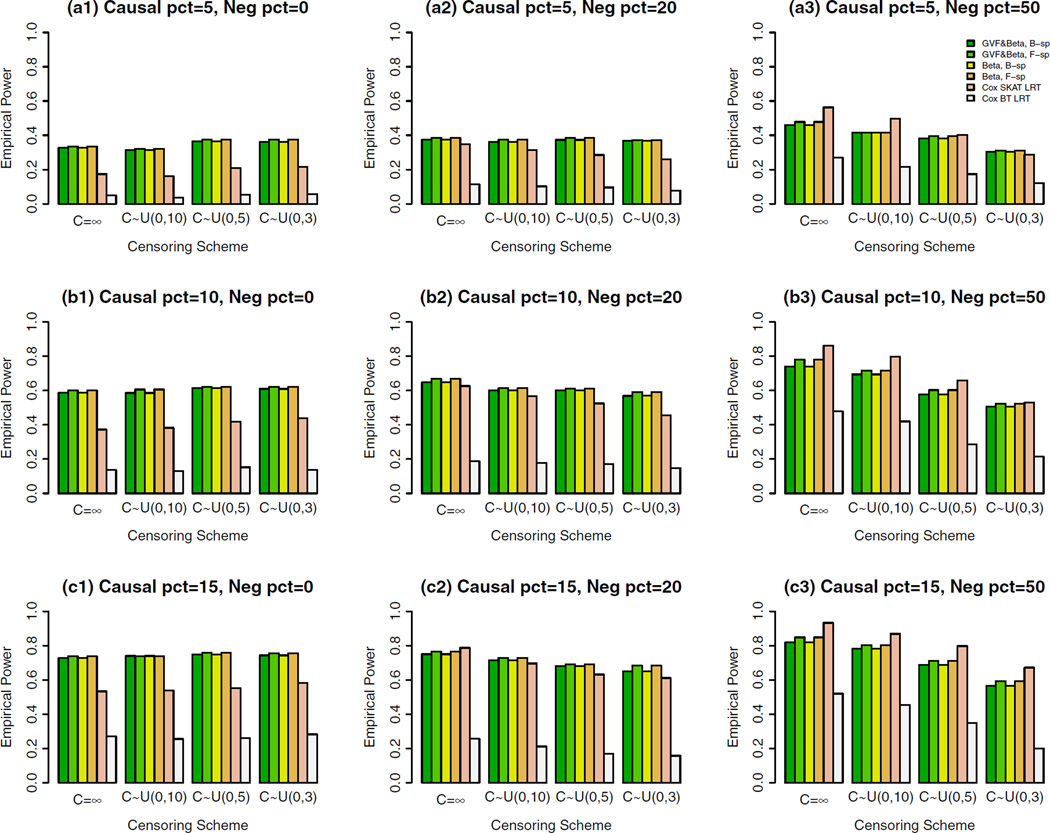
Figure 2. The Empirical Power of the Cox FR LRT Statistics of the Cox Models (4) and (5) and Cox SKAT LRT and Cox BT LRT by Chen et al. (2014) at α = 0.001, When All Causal Variants are Rare and a Sample Size of 2,000.
When Neg pct = 0, All Causal Variants Had Positive Effects; When Neg pct = 20, Causal Variants Had Negative/Positive Effects; When Neg pct = 50, 50%/50% Causal Variants Had Negative/Positive Effects.

