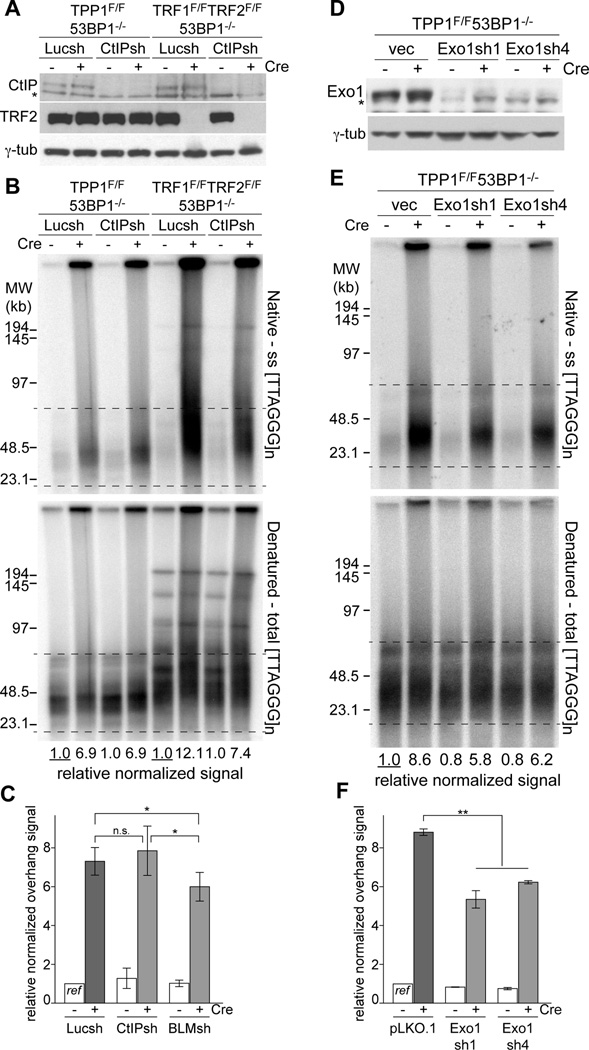
Figure 5. Exo1 and BLM, but not CtIP-dependent resection in TPP1/53BP1 DKO.
(A) Immunoblotting showing equal knockdown of CtIP in TPP1F/F53BP1−/− and TRF1F/FTRF2F/F53BP1−/−p53−/− MEFs treated with Cre. Cells were analyzed at 96 h after the second Cre infection. Asterisk: non-specific band.
(B) In-gel overhang assay of shCtIP treated TPP1/53BP1 DKO and TRF1/TRF2/53BP1 TKO cells as in (A). For each cell line, the relative normalized overhang signal obtained from Luciferase sh treated cells without Cre were set as 1.0 and the other values were expressed relative to this reference.
(C) Quantification of the overhang signals as in (B). Bars show means ± SDs from ≥3 independent experiments. *, P < 0.05 (two-tailed Student’s t test).
(D) Immunoblot for Exo1 knockdown in the TPP1/53BP1 DKO cells at 96 h after Cre treatment. Asterisk: non-specific band.
(E) In-gel overhang assays on indicated MEFs (as in (D)) at 96 h after Cre infection.
(F) Quantification of the overhang signals as in (E). Graph shows means ± SEMs from two independent experiments. **, P < 0.01 from two-tailed Student’s t test on the combined results of the two Exo1 shRNAs. See also Figure S6.

