
Figure 1. Data collection.
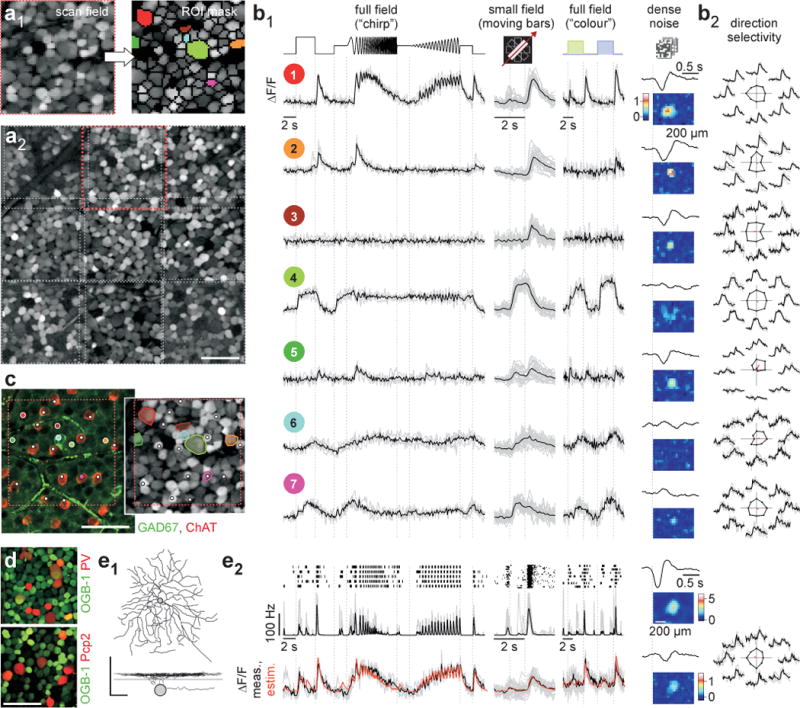
a, whole-mounted mouse retina, electroporated with OGB-1 and recorded with a two-photon microscope (64×64 pixel @ 7.8 Hz) in the GCL. Scan fields (a1, left; 110×110 μm) comprised 80 ± 20 cells. Regions-of-interest (ROIs) (a1, right), were placed semi-automatically. Montage (a2) of 9 consecutively recorded fields (rectangles; a1 in red). b, Ca2+ signals from 7 ROIs colour-coded in (a1). Single trials in grey, averages of n=4 (“chirp”, green/blue) or 24 (moving bars) trials in black (b1). Responses to 4 visual stimuli (b1): Full-field “chirp”, bright bars moving in 8 directions, full-field alternating green/blue and binary noise for space-time kernels. Direction- and orientation-selectivity (b2): Traces by motion direction; polar plot of peak response, vector sum in red. c, left: experiment in (a) immunostained for GAD67 (green; GABAergic ACs) and ChAT (red; starburst-ACs). Right: from (a1); both images show same colour-coded ROIs (left, dots, right, ROI outlines) and starburst-ACs (white dots): cell 6 is GAD67-positive, cell 7 is a starburst-AC. d, OGB-1 (green) electroporated retina from transgenic mice with tdTomato (red) expressed in sets of RGCs (top: PV; bottom: Pcp2). e, simultaneous Ca2+ imaging and electrical recording: dye-filled, anatomically reconstructed cell (e1, top: whole-mount; bottom: profile, lines mark ChAT bands). Light responses (e2) from top to bottom: spike raster and rate (20 ms bins), recorded (black) and reconstructed (orange) Ca2+ signal. Scale bars: 50 μm unless indicated.