
Figure 2. Functional RGC types of the mouse retina.
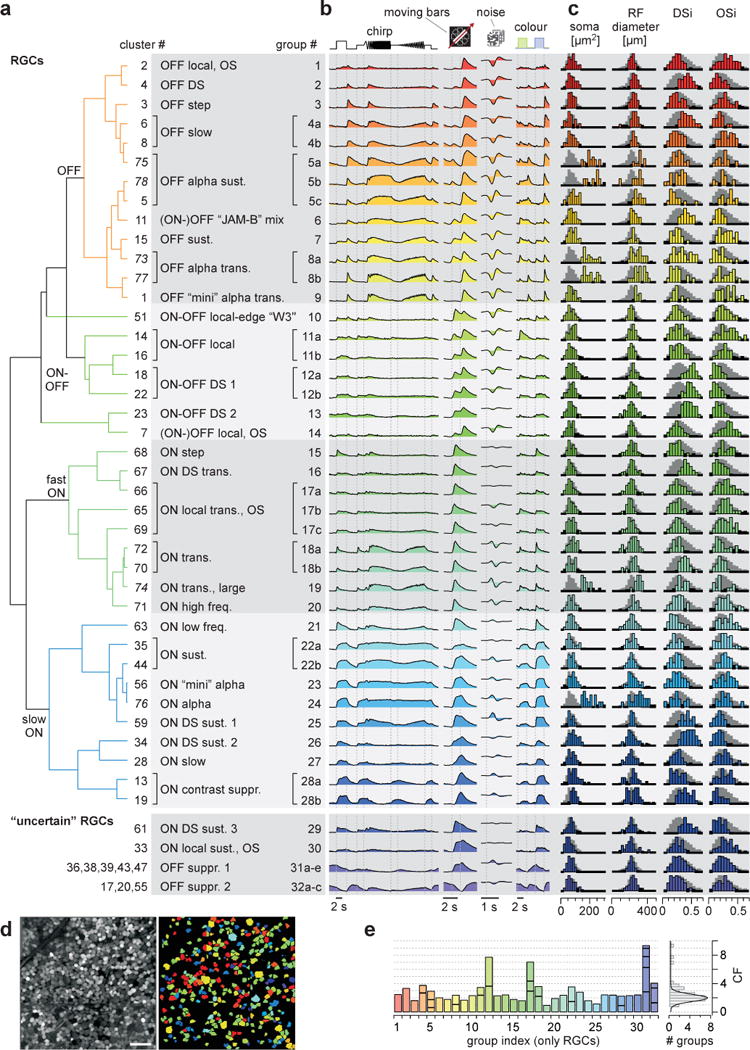
a, cluster-dendrogram (Methods) with groups indicated: n=28 RGC and n=4 “uncertain” RGC groups. b, cluster-mean Ca2+ responses to the 4 stimuli. c, selected metrics, from left to right: ROI (soma) area, receptive field (RF) diameter (2 s.d. of Gaussian), DS-index and OS-index (Methods). Background-histograms demarcate all RGCs. d, experiment (left, from Fig. 1a2) with RGCs colour-coded by group (right). dACs and discarded cells not shown. e, Coverage factor (CF) calculated from RF-area for RGC groups, with horizontal divisions delineating individual clusters (left) and distribution of CFs across groups (right). Scale bar in d, 50 μm.