
Figure 4. Direction- and orientation-selectivity.
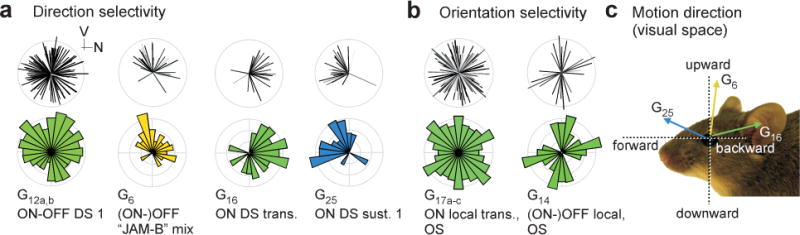
a, pairs of retinocentric polar plots showing distributions of preferred motion directions of selected direction-selective (DS) RGC groups (V, ventral; N, nasal). Top, plot of each pair: preferred directions, with length representing DSi and grey level p(DS) (Methods). Bottom, plot of each pair: circular area-normalised histogram. b, like (a), selected orientation-selective (OS) RGCs. Further DS/OS groups detailed in Extended Data Fig. E7. c, motion directions in the visual space of the mouse.