
Figure 5. Mapping RGC groups to morphologies.
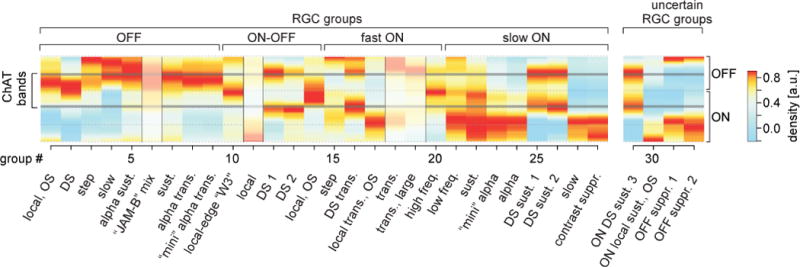
Heat map of each RGC group’s estimated dendritic stratification across the IPL (cf. Fig. 2); ON/OFF sublaminae and ChAT bands indicated. Warmer colours represent higher dendritic densities (Methods). Shaded IPL profiles indicate deviation from known stratification pattern (G6) or an unexpected pattern given a potentially novel group’s response polarity (G11,18,19).