
Figure E2. Clustering and grouping (related to Fig. 2).
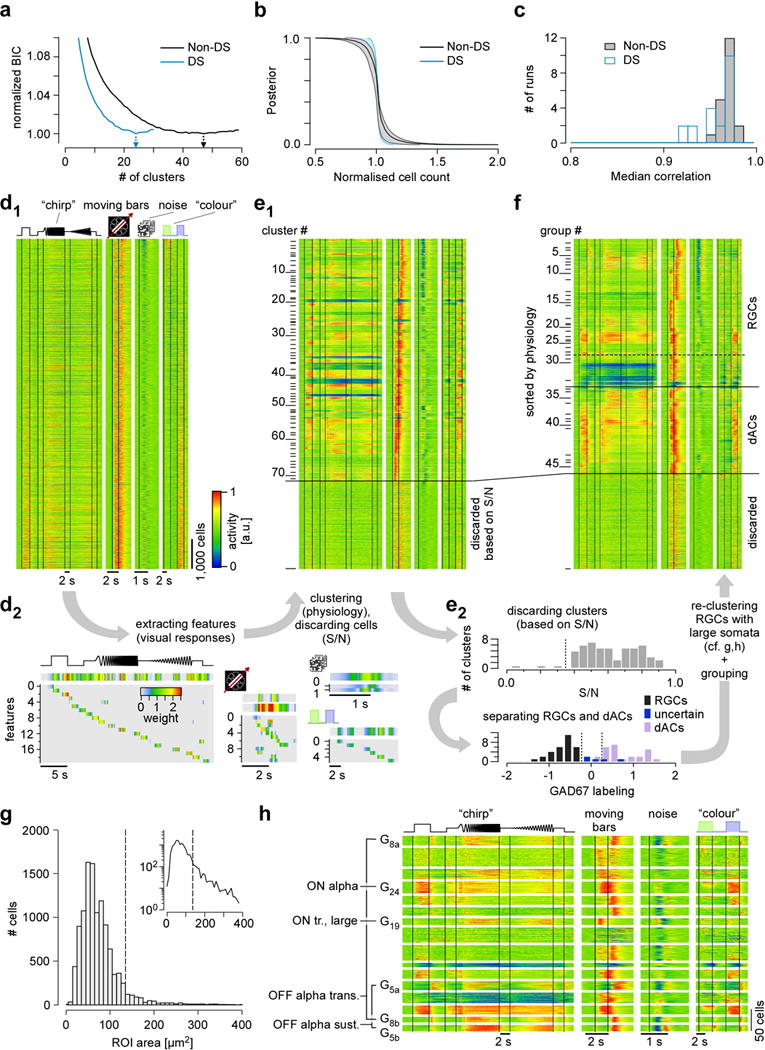
a–c. Selection of cluster size and cluster quality/consistency analysis. a, normalised Bayesian Information Criterion (BIC) curves for non-DS (black) and DS (blue) cells. Arrows indicate the optimal numbers of clusters. b, rank-ordered posterior probability curves indicating cluster quality. Curves were normalised for cluster size and averaged for non-DS (black) and DS (blue) clusters separately. Shaded area indicates 1 s.d. across clusters. c, histogram of median correlation between the original clusters and clusters identified on 20 surrogate datasets, created by repeated subsampling of 90% of the original dataset (bootstrapping); for each cluster, the best matching cluster from the original clustering was selected. d, heat maps of Ca2+ responses (d1) to the 4 visual stimuli (cf. Fig. 1) of n=11,210 cells from 50 retinas. Shown are raw data sorted by the response to the colour stimulus. Each line represents responses of a single cell with activity colour-coded such that warmer colours represent increased activity. Temporal features (d2) were extracted from the cells’ light responses (Methods) and used for automatic clustering (d1 → e1). e, heat maps showing clustered data (e1, n=72 clusters plus cells discarded based on signal-to-noise (S/N) ratio), with block height representing the number of included cells. Distributions of S/N (e2, top) and GAD67 labelling (e2, bottom) used to discard clusters and sort the remaining ones into retinal ganglion cells (RGCs), “uncertain” RGCs and displaced amacrine cells (dACs). f, heat maps showing n=46 groups (divided into n=32 RGC groups, including n=4 “uncertain” ones, and n=14 dAC groups; sorted by response similarities) after re-clustering of large-soma cells (alpha cell post-processing, see panels g,h). g, distribution of region of interest (ROI) area (as proxy for soma size) for all cells classified as RGCs and “uncertain” (e2). Inset: same distribution but on a log-scale. Dashed line marks threshold to separating large-soma cells (Methods). h, results of re-clustering of large-soma cells (from g): heat maps show light-evoked Ca2+ responses to the 4 visual stimuli (cf. Fig. 1b). Clusters that resulted in new RGC groups are indicated; the remaining cells stayed with their original clusters.