
Figure E3. Group overview – Functional groups classified as “uncertain” RGCs and displaced amacrine cell (dAC) in the mouse retina (related to Fig. 2).
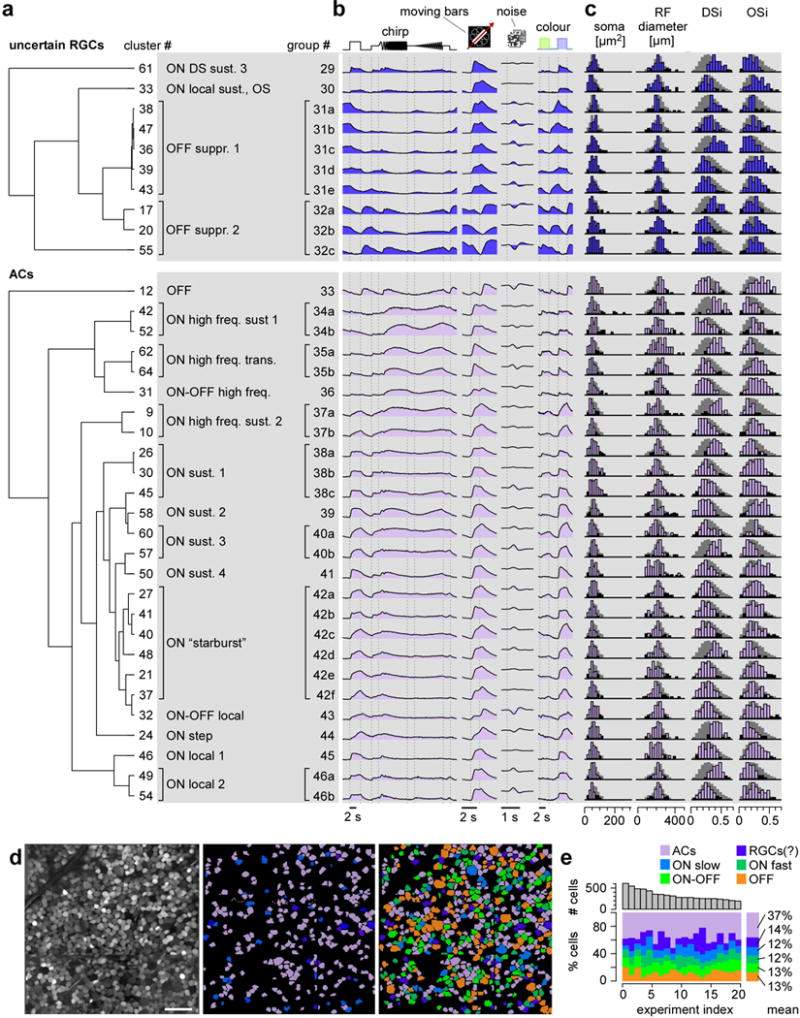
a, clusters organised according to hierarchical trees (dendrograms, see Methods) and grouped based on functional similarity (see main text for details), resulting in n=4 “uncertain” RGC (top) and n=14 dAC groups (bottom). b, mean Ca2+ responses to the 4 stimuli (cf. Fig. 1b) for each cluster. c, histograms of selected properties, from left to right: ROI (soma) area, receptive field (RF) diameter (2 s.d. from Gaussian fit; see Fig. 1b1 and Fig. E4), DS and OS indices (DSi and OSi, respectively, Methods). For details on each cluster, see also SI Data 140–49 (“uncertain”), and SI Data 150–75 (dACs). d, example experiment (left, from Fig. 1a2); centre: showing dACs (lilac) and “uncertain” RGCs (blue); right: colour-coded by broad categories, as in (e). e, total number of cells (top) and percentage of cells in sets of groups (bottom) per experiment (only experiments with ≥198 cells) illustrating consistency across experiments. Scale bar: d, 50 μm.