
Figure E5. Mapping RGC groups onto genetic types – Functional diversity of PV- and Pcp2-positive RGCs (related to Fig. 2).
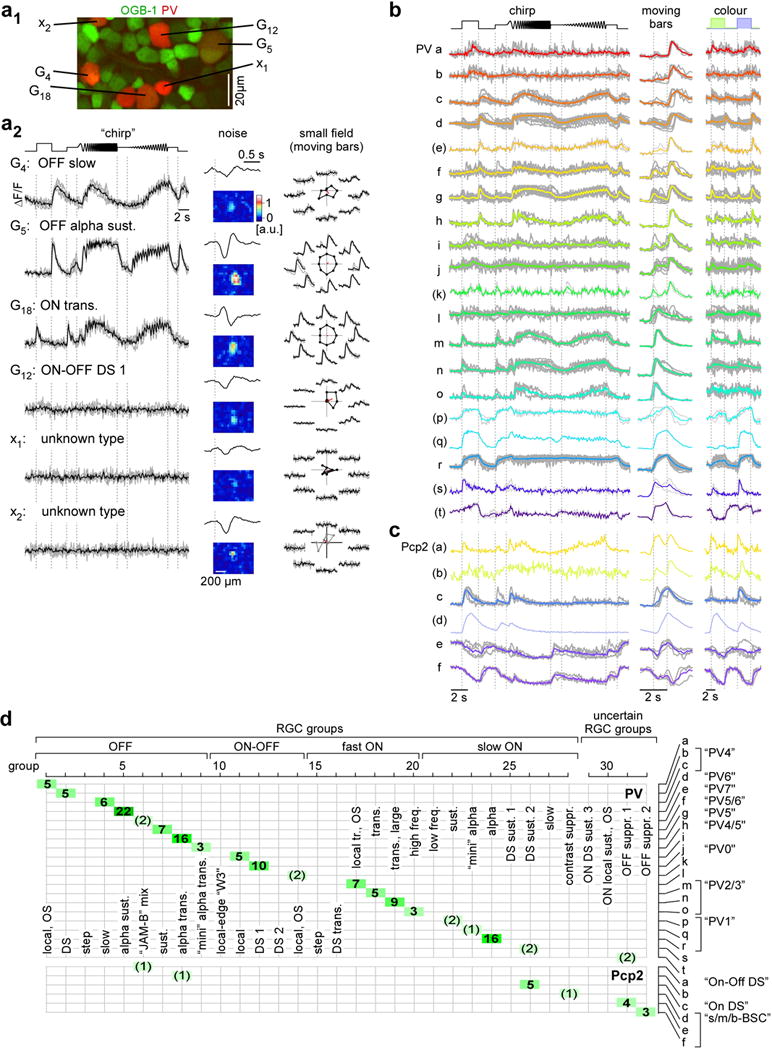
a, diversity of PV-positive RGCs (red) in a PV:tdTomato mouse retina electroporated with OGB-1 (a1, green). Ca2+ responses and receptive fields (a2) from 6 PV-positive cells in exemplary field are shown (black, mean response, grey, single trials). The top four cells could be clearly matched to RGC groups (cf. Fig. 2), whereas the remaining two (x1, x2) were discarded due to the lack of responses to both full-field and moving bar stimuli; note, however that both cells yielded a clear RF. b, Ca2+ responses of functionally distinct PV-RGC groups (20 response types PV a-t, thereof 14 with n ≥ 3 cells). Traces colour-coded by group assignment (colours as in Fig. 2) represent mean responses, with individual cell responses in grey. c, same for Pcp2-positive (6 response types Pcp2 a-f, thereof 3 with n ≥ 3 cells) RGC groups. d, table illustrating the relationship between RGC groups (Fig. 2) and functional PV- and Pcp2-positive RGC types from (a,b). Numbers represent the total cell count of each allocation. Names in quotes (e.g. “PV5”) refer to the cells’ original names (see PV-45 and Pcp2-study56).