
Figure E8. Retinal distribution of PV-positive cells in the PVCre × Ai9tdTomato mouse line (related to Fig. 2).
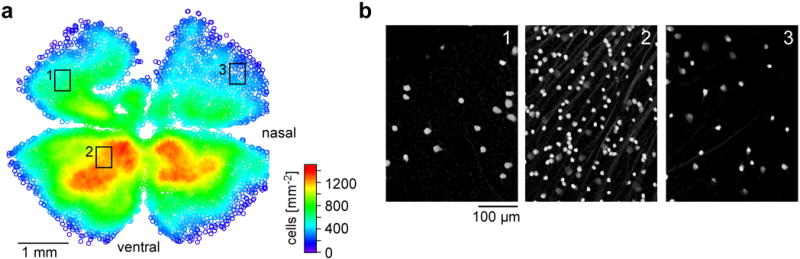
a,b, density map (a) and magnified sample areas (b) illustrate PV-labelling anisotropy.
Official websites use .gov
A
.gov website belongs to an official
government organization in the United States.
Secure .gov websites use HTTPS
A lock (
) or https:// means you've safely
connected to the .gov website. Share sensitive
information only on official, secure websites.
a,b, density map (a) and magnified sample areas (b) illustrate PV-labelling anisotropy.