
Figure E9. Mapping RGC groups to morphologies.
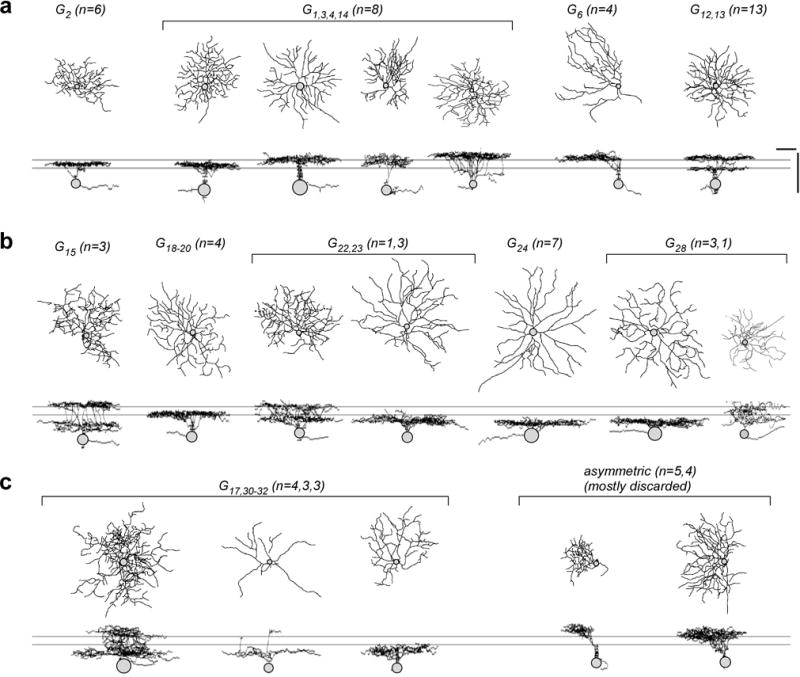
a–c, exemplary morphologies of RGCs filled after electrical recording or Ca2+ imaging and subsequently clustered/sorted into specific RGC groups or discarded (c, right) based on their light response S/N. Scale bars: 50 μm.