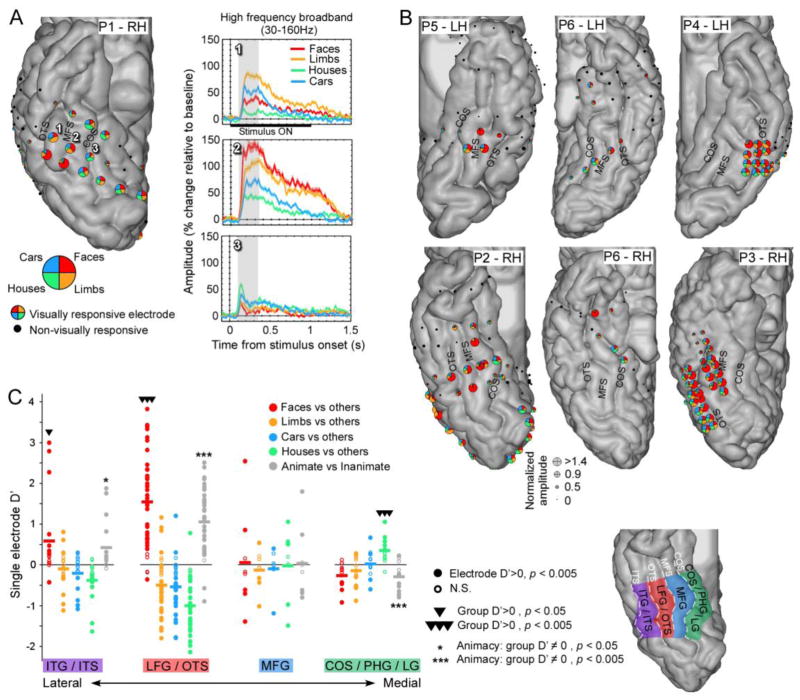
Figure 2. Spatial distribution of ECoG category selectivity in human ventral temporal cortex is consistent across participants.
(A–B) Localization of electrodes, visual responsivity and category preference in each participant. (A) Spatial distribution of electrode selectivity in an example right hemisphere (ventral view of the temporal lobe), and HFB-responses as a function of time in three example electrodes spaced one centimeter apart. On the cortex, each electrode is represented by a pie chart plotting the relative amplitude elicited by each category (averaged over responses to images of dataset 1) in the HFB range (30–160 Hz) during a time window of 100–350ms after stimulus onset. The diameter of each pie chart is scaled according to its normalized amplitude of response. (B) Spatial organization of ECoG category-selectivity in all other hemispheres. Note that electrodes both within and outside VTC are shown, highlighting the particular sensitivity of VTC to visual object categories. (C) Selectivity in each electrode (d′) in four anatomical regions arranged from lateral to medial across the VTC. Each circle represents an electrode, where filled circles show significant positive category-selectivity (p < 0.005). For each electrode we show its selectivity to each category as well as to the animate vs. inanimate stimuli distinction. Horizontal lines represent the average d′ across electrodes for each anatomical region. Electrodes overlapping the mid-fusiform sulcus (MFS), lateral fusiform gyrus (LFG) and occipito-temporal sulcus (OTS) show face-selectivity. Preferential responses to inanimate stimuli occurred in the medial fusiform gyrus (MFG), collateral sulcus (CoS) and parahippocampal gyrus (PHG).

