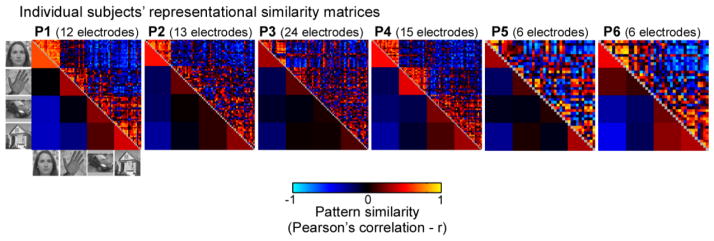
Figure 4. Representational similarity matrices (RSM) of distributed HFB responses across VTC.
RSM of distributed VTC responses between each pairs of images from data set 2 are shown for each participant. Distributed responses were calculated for each participant across all of their VTC electrodes (electrode count indicated at the top of each panel) for HFB-responses averaged over a time window of 100–350ms after stimulus onset. Responses were averaged across 2–5 presentations of an image (excluding the first presentation). The top triangle shows the correlation of the distributed responses to each pair of images (40–80 images per participant), the bottom triangle shows the average correlation across all pairs of images of a category, excluding the diagonal.

