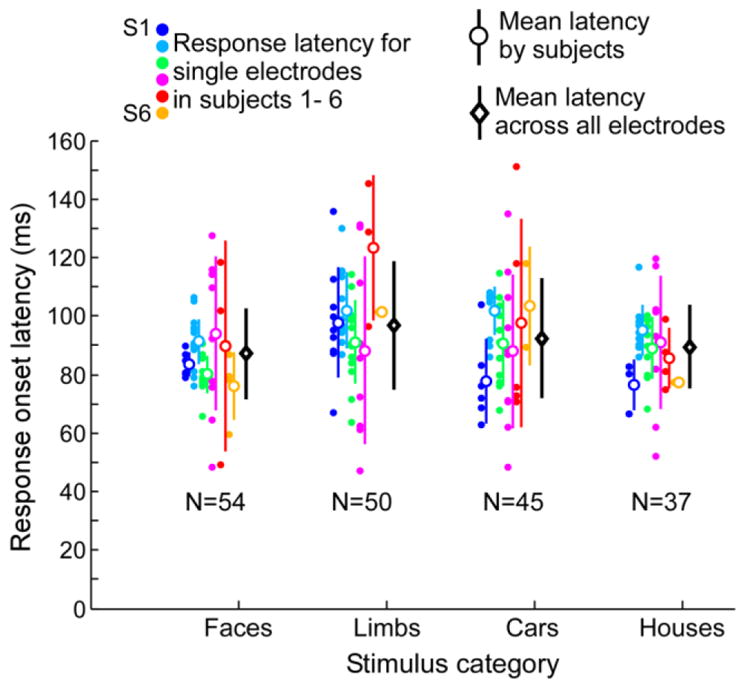
Figure 8. ECoG HFB response latency across visually responsive VTC electrodes.

Response latencies at each visually responsive VTC electrode are shown for each category and participant (filled circles), along with the average (± STD) across electrodes in each participant (open circles) and the average across all electrodes and participants by category (black diamonds). The number of electrodes included for each category is shown below each group of plots. Some electrodes respond significantly to more than one category. Thus, the same electrode may appear in multiple category bins.
