
Figure 3.
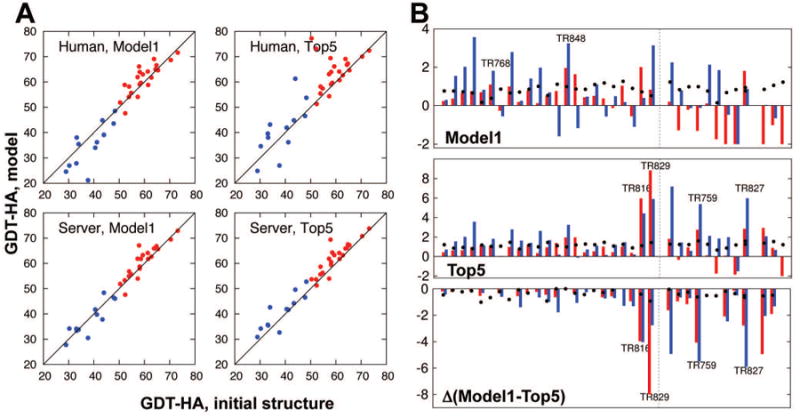
Overall results in CASP11 refinement category by Baker group. A) GDT-HA comparison between starting structures and refined models for human (upper) and server (lower) submissions. Results for the models submitted as model1 are plotted at left, and for the best among five models (top5) at right. Dots above diagonal lines are those targets improved over starting structures. The high-resolution strategy was used for the red targets, and the low-resolution strategy, for the blue targets. B) Per target Z-score for model1 (left), best among five (top5, middle), and the difference between the two (right). Red and blue bars represent Z-scores in GDT-HA and SphereGrinder [21,22], respectively. Black dots show Z-scores in MolProbity [23]. Positive values are improvements for all the quality measures. Dotted lines at the center of each panel show the border between targets that underwent high-resolution and low-resolution refinement strategies.