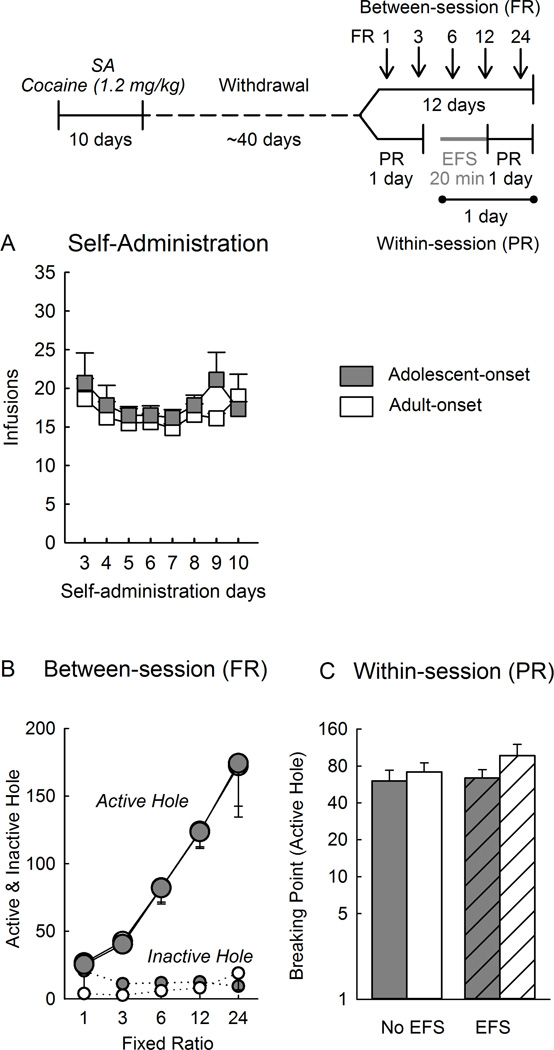
Figure 4.
Progressive ratio of cocaine self-administration at a high dose (1.2 mg/kg/infusion) in rats that self-administered cocaine as adolescents or adults. The top panel shows the experimental timeline. A) Self-administration (SA) of cocaine across days. B) Between-session progressive ratio schedule across days and ratios (2 days/FR schedule, 1.5 h/session). Data are averaged over 2 days at the same fixed ratio. Each point represents the mean nose pokes ± SEM of each group at each ratio. C) Within-session progressive ratio schedule showing the “breaking point” (highest ratio reached to obtain an infusion of cocaine). The left two bars show responding in the absence of electric footshock (no EFS) and the right bars show responding after electric footshock (EFS). Data are presented in logarithmic scale. Each vertical bar represents the mean ± SEM of each group. EFS: Electric footshock; FR: Fixed ratio. Between-session adolescents n=9 and adults n=11; Within-session adolescents n=10 and adults n=18.

