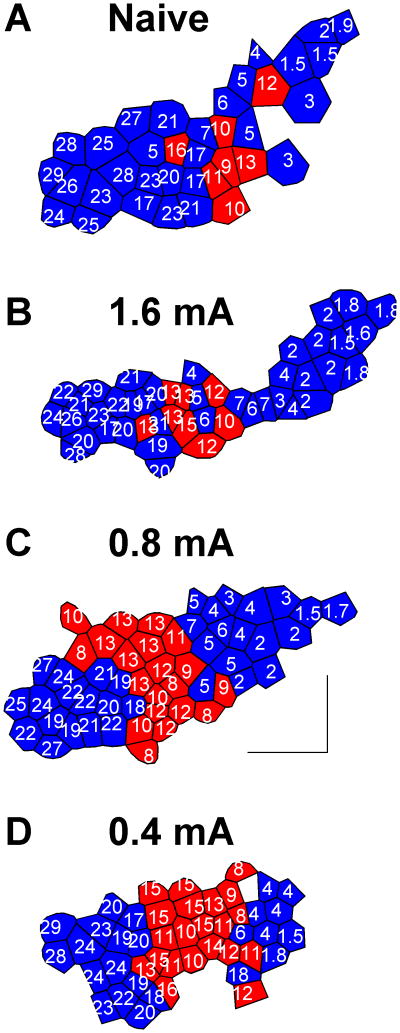
Figure 2.
Frequency map plasticity in primary auditory cortex. Each polygon represents a single electrode penetration. The characteristic frequency (CF) of each site is indicated in kHz. The red color indicates that the value of the CF is between 8 and 16 kHz. Representative frequency map from a naïve rat (A). Representative frequency map from a rat that received 1.6 mA VNS (B), 0.8 mA VNS (C) or 0.4 mA VNS (D) paired with 9 kHz tones. Moderate VNS-tone pairing reorganizes the frequency map, but intense VNS-tone pairing does not. The scale bar indicates a distance of 0.5 mm. Anterior is shown to the left and dorsal is down.

