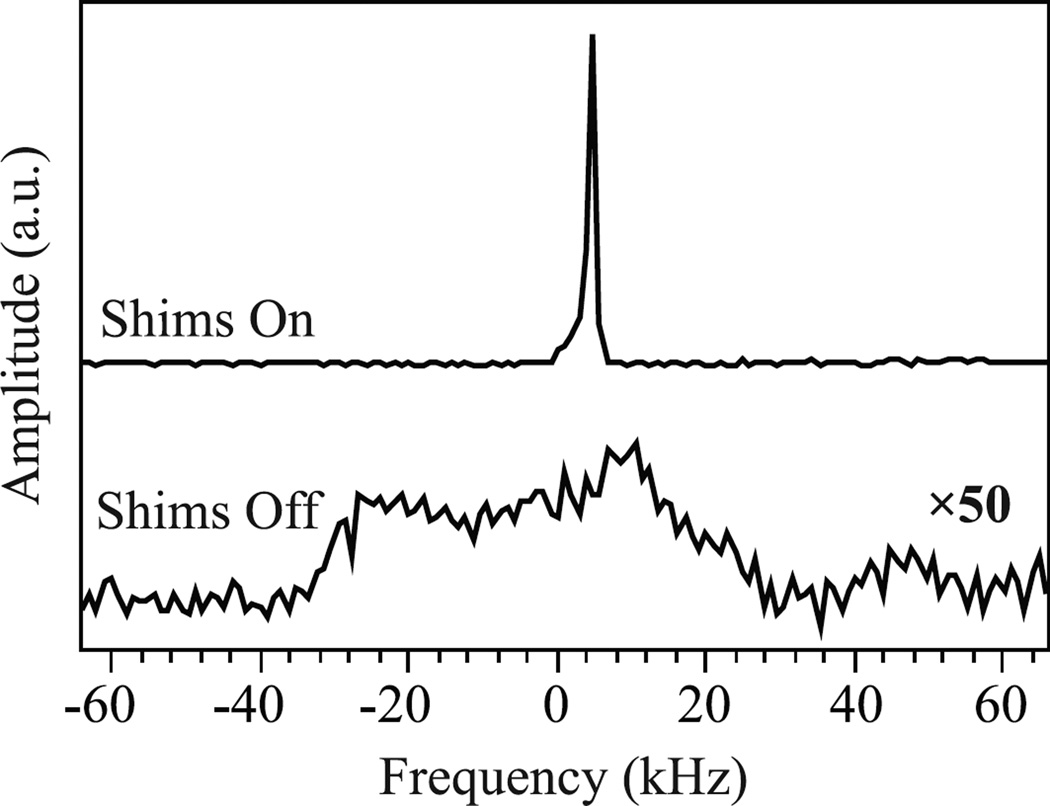
Figure 4.
Comparison of the DNP-enhanced NMR signal in the 0.35 T location in the fringe field of a 1.5 T MRI magnet with shims (top) and without shims (bottom), where the bottom trace is multiplied by a factor of 50. The top and bottom spectra were taken by averaging 32 scans and 1000 scans, respectively.

