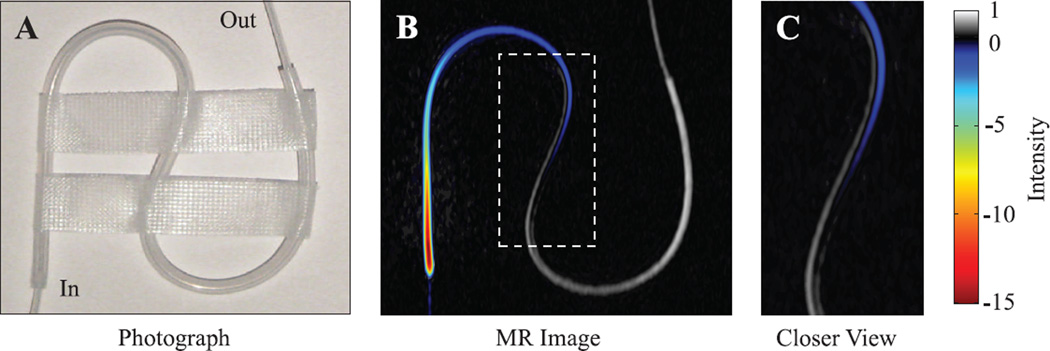
Figure 5.
(A) Photograph and (B) 1.5 T MR image of the tubing phantom. The water enters the tube at the bottom left from small inner diameter tubing that is barely visible in the enhanced MR image, flowing at a rate of 1.5 mL/min. The color and gray portions of the image represent enhanced and unenhanced signal, respectively. The enhanced signal is visible for a distance of 10.4 cm and an observation time of 8.2 s, assuming the applied 1.5 mL/min flow rate is correct for the flow on the outside edge of the tube. The dashed rectangle in (B) is enlarged in panel (C). Images are available in color online.

