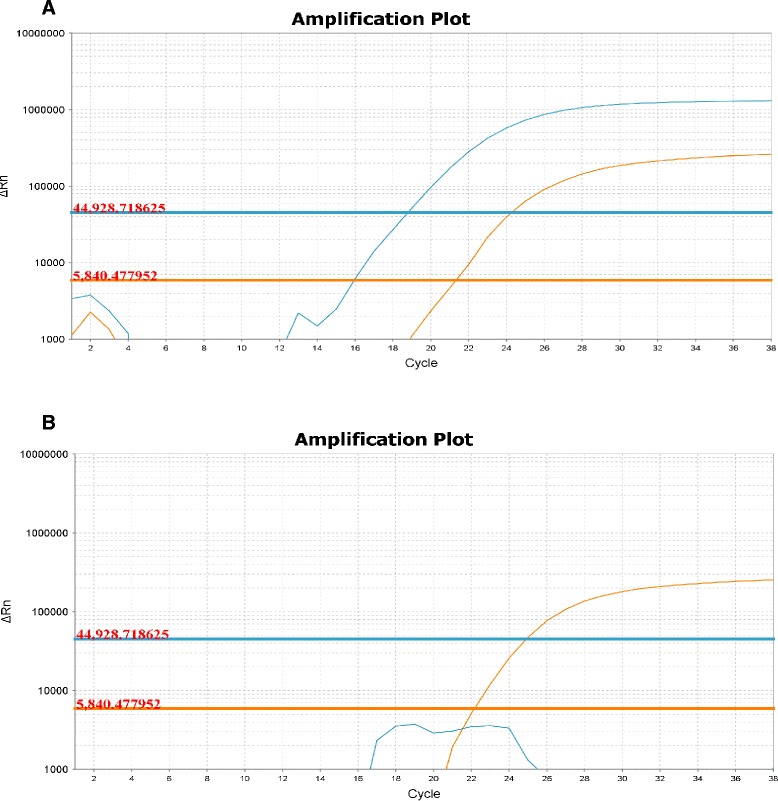
Fig. 2.

Amplification curve of qPCR assay. a amplification curves of a heteroplasmic spore showing two amplification curves corresponding to each parental haplotype R. irregularis DAOM197198 (in orange) and R. irregularis DAOM240415 (in blue) b amplification curve of a homoplasmic monosporal culture assay containing both markers but showing the presence of only one parental haplotype; R. irregularis DAOM197198 (in orange) and R. irregularis DAOM240415 (in blue)
