
Figure 6.
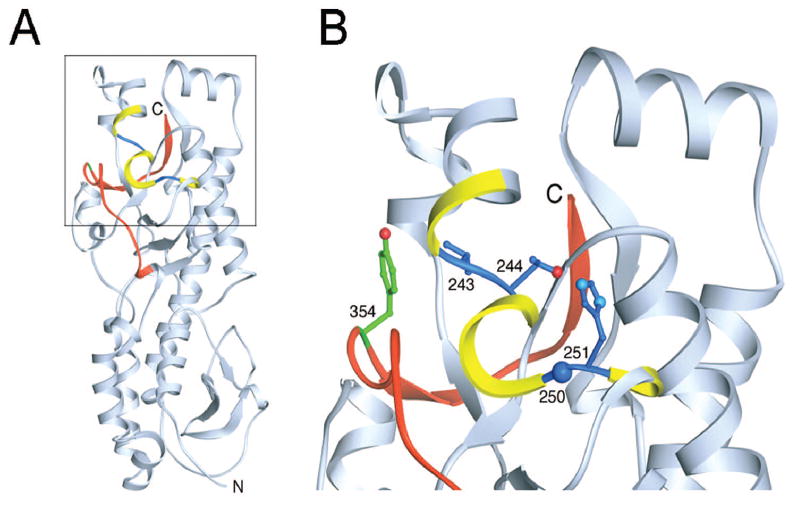
The σ3 protein. A) Ribbon diagram of the crystal structure of T3D σ3.73 The cathepsin L cleavage sites in T1L are depicted in blue between amino acids 243 and 244 and between 250 and 251.65 Surrounding residues, from amino acids 241 to 253, are shown in yellow. The C-terminal residues of σ3, from amino acids 340 to 365, are colored red. Tyrosine 354, which is altered in several PI,75 D-EA,59 and ACA-D viruses,76 is colored green. The virion-distal end of σ3 is at the top of the figure, and the virion proximal end and N-terminus are at the bottom. B) An enlarged view of the boxed region of σ3 indicated in panel B is shown using the same color scheme. Amino acids 243, 244, 250, 251, and 354 are depicted in ball-and-stick representation. Figure and legend modified from: Ebert DH et al, J Biol Chem 277:24609-24617; ©2002 with permission from the American Society for Biochemistry and Molecular Biology.65