
Figure 7.
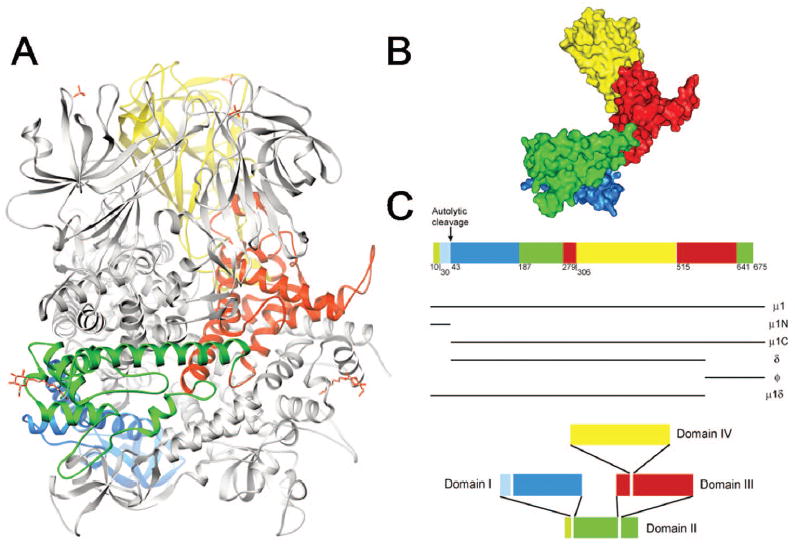
The μ1 protein. A) Ribbon diagram of the crystal structure of the T1L μ1 trimer without bound σ3.88 One μ1 subunit is colored by domain (domain I, light and dark blue [μ1N, μ1C]; domain II, light and dark green [μ1N, μ1C]; domain III, red; domain IV, yellow); the other two μ1 subunits are shown in gray. β-octyl glucosides and sulfate ions present in the structure are shown in red and yellow. B) Surface-shaded representation of an isolated μ1 subunit. Colors and orientation are as in (A). C) Domain segmentation of the amino acid sequence as determined from the three-dimensional structure. Domain color code as in (A) and (B). The central domain II contains domains I and III as “inserts,” and domain III similarly contains domain IV. Figure and legend modified from: Liemann S et al, Cell 108:283-295; ©2002 with permission from Elsevier.88