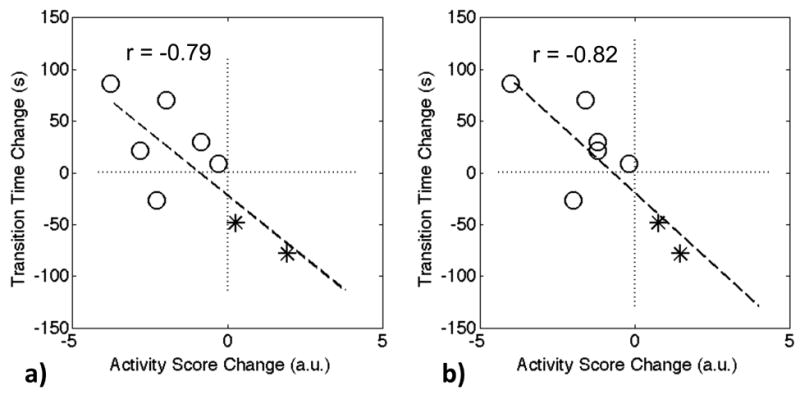
Figure 4.

The change of the transition time dT in synovitis (5 s resolution) between the baseline and 3-month follow-up scans is highly correlated with the change of the activity score, a) DAS28-ESR, and b) DAS28-CRP. The data points marked with circles are Group II patients, and the rest two points marked with asterisks denote Group I patients.
