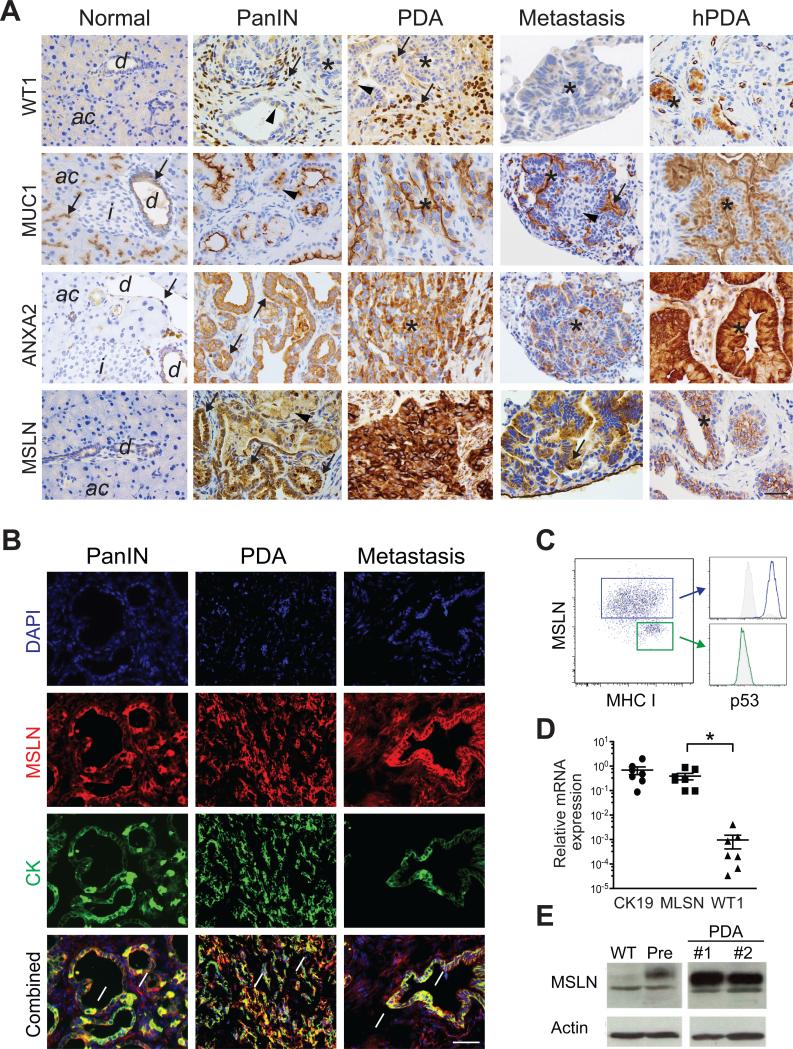
Figure 1. Tumor antigen expression in murine and human PDA.
(A) Immunohistochemical analyses of target antigens in murine and human (hPDA) tissues. d, duct; ac, acini; i, islets; arrows, high expression; arrowheads, low-moderate expression; *, tumor epithelial cells. Scale bar, 25 μm.
(B) Immunofluorescence for MSLN and cytokeratin (CK) in indicated KPC tissues. Arrows, MSLN+CK+ cells. Scale bar, 25 μm.
(C) FACs plot of MSLN, MHC I and p53 in early passage (<3X) primary KPC PDA cells.
(D) Relative expression of indicated mRNAs in primary KPC PDA cells. Each point represents an independent cell preparation. Mean ± SEM.
(E) Immunoblot analyses of primary murine pancreatic ductal cells, primary preinvasive KC cells (Pre) and two independent invasive KPC PDA primary cell preparations.
See also Figure S1.

