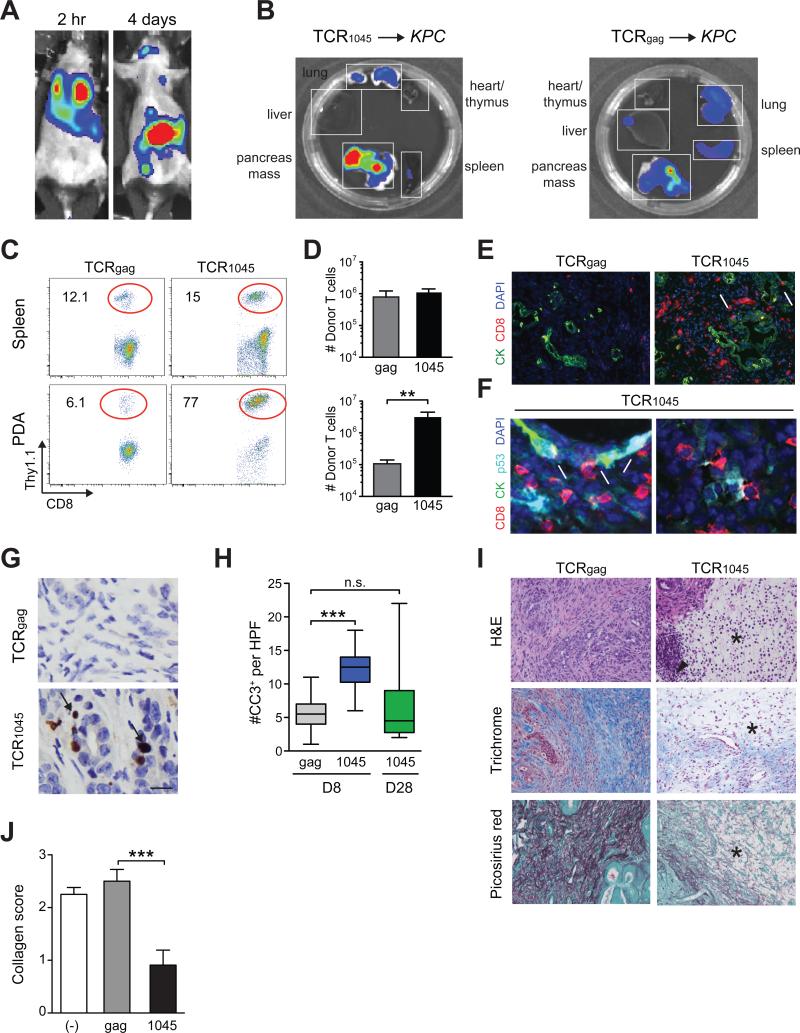
Figure 3. Biodistribution and in vivo effects of genetically engineered TCR1045 T cells.
(A) Biodistribution of TCR1045 T cells 2 hr and 4 days post transfer into KPC mouse.
(B) Distribution of donor TCR1045 or TCRgag cells in tissues ex vivo 8 days post transfer.
(C) Donor T cell frequency 8 days post transfer. Plots are gated on CD45+CD8+ cells.
(D) Number of donor T cells isolated from spleen (top) and tumor (bottom) 8 days post transfer.
(E) Immunofluorescence for CD8 and CK in primary tumors 8 days post transfer. Scale bar, 50 μm; arrows, CD8 T cells adjacent to epithelium.
(F) Immunofluorescence for indicated molecules in primary tumors 8 days post TCR1045 cell transfer. Arrows, CD8 T cells adjacent to p53+CK19+ tumor cells; arrowheads, p53+CK19− cells in the stroma. Scale bar, 10 μm.
(G) IHC for cleaved-caspase 3 (CC3) in PDA at day 8. Arrows, CC3+ cells. Scale bar, 10 μm.
(H) Tumor apoptosis 8 and 28 days post T cell transfer.
(I) Histology of pancreatic tumors 8 days post T cell transfer. *, absence of interstitial pink (H&E), blue (Masson's trichrome) and red (Picosirius) stain reflects a loss in ECM collagen content. Arrowhead, infiltrating mononuclear cells. Scale bar, 50 μm.
(J) Quantification of collagen content in tumors from (I).
Data are shown as mean ± SEM. See also Figure S3.

