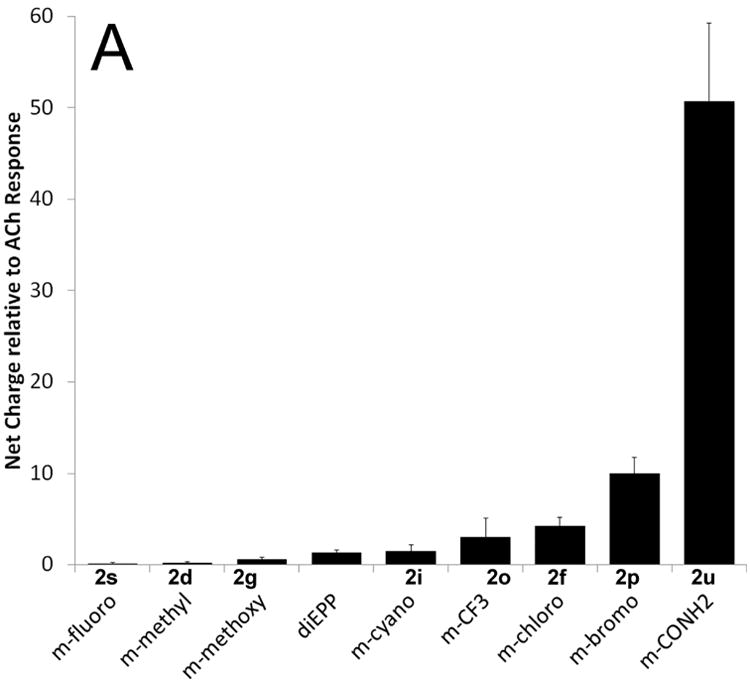
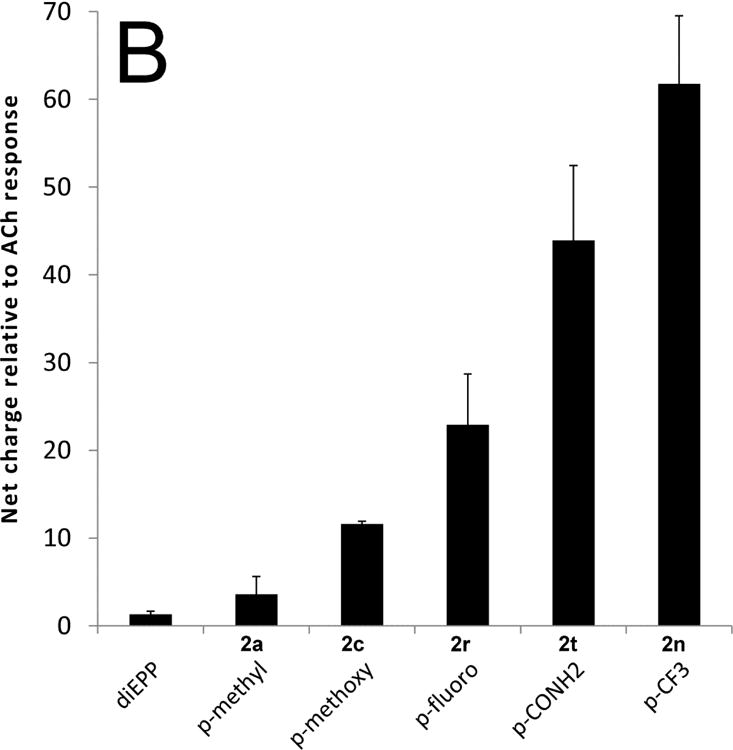
Figure 3.


Activity of diEPP compounds and analogs with the α7 nAChR. The left vertical axis refers to the net-charge response of compounds when compounds (30 μM) were co-applied with 10 μM PNU-120596, relative to ACh controls. Experimental values are the average of at least 4 independent measurements, and the error bars reflect the calculated standard deviation of the mean. In all cases these compounds showed less than 10% of the control ACh response when they were applied alone to the receptor. For reference, all figures include the reference response of diEPP. A) Data for the meta-substituted compounds 2. B) Data for the para substituted compounds 2. C) Data for selected compounds 1r,f,n,p (left side) and compounds 6 and 8 (right side).
