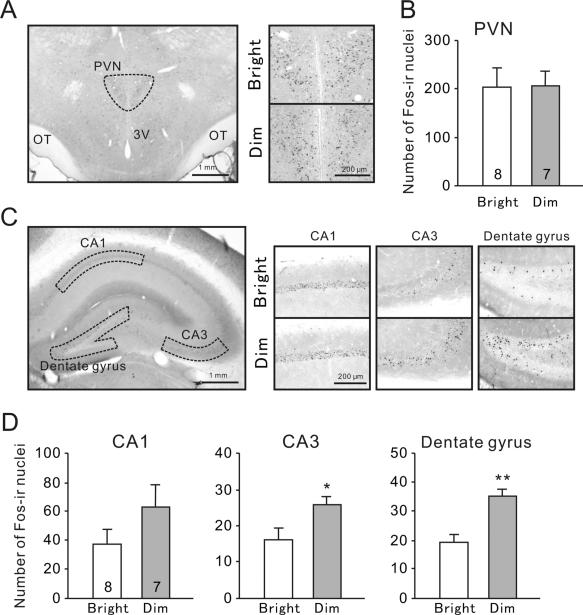
Fig. 3.
Fos expression following the marble burying test. (A) Representative photographs of Fosir in the PVN. OT, optic tract; 3V, third ventricle. (B) Numbers of Fos-ir nuclei in the PVN. (C) Representative photographs of Fos-ir nuclei in hippocampal subfields i.e., the CA1, CA3, and dentate gyrus. (D) Numbers of Fos-ir nuclei in the hippocampal subfields. Results are shown as mean ± SEM. Numbers on each column indicate the sample size. *P < 0.05, **P < 0.01.

