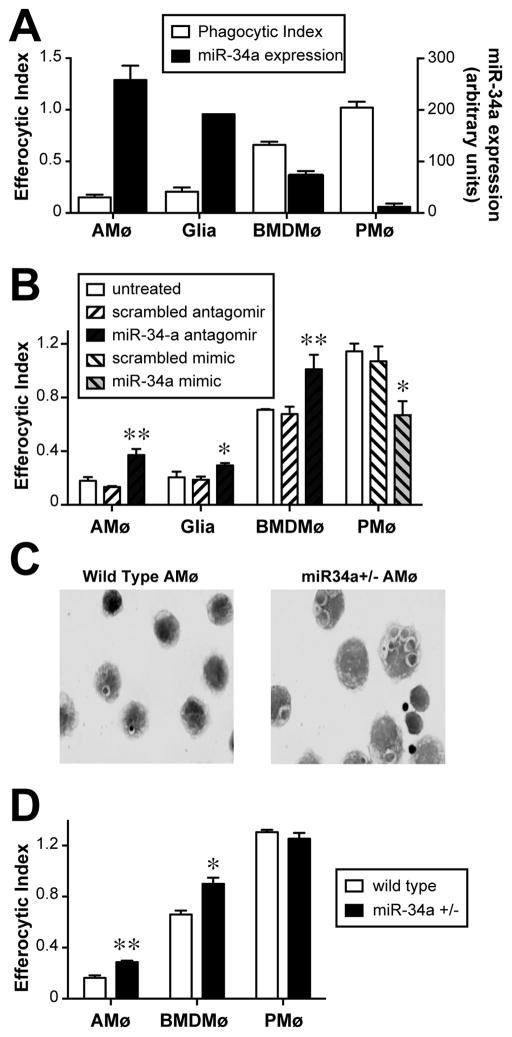
Figure 1. miR-34a negatively regulates efferocytosis.
A. AMø, glia, BMDMø and PMø were either incubated with AC in chamber slides for 1.5 h, then stained using H&E and assayed for efferocytosis (left-hand axis), or were assayed by quantitative real-time RT-PCR for expression of miR-34a relative to sno-142 (right-hand axis). Note inverse relationship between phagocytic index and miR-34a expression. Data are mean ± SEM of at least three replicates of each cell type from two independent experiments. B. Using RNAiMAX Lipofectamine, AMø, glia, BMDMø were transfected with control or miR-34a-specific antagomirs and PMø were transfected with control or miR-34a-specific mimics. AC engulfment was assessed by microscopy after 1.5 h. Data are mean ± SEM of at least three replicates of each cell type from two independent experiments; *, p<0.05; **, p<0.01 by one-way ANOVA with Bonferroni post-hoc testing. C, D. miR-34a flox/flox mice were crossed with LysM cre mice resulting in miR-34a flox/−, LysM cre offspring (miR-34a+/−) with miR-34a haplosufficient myeloid cells. Resident AMø, PMø and BMDMø harvested form wt mice and miR-34a +/− mice were exposed to AC in chamber slides for 1.5 h, then washed, stained with H&E and counted. C. Representative photos of in vitro AC engulfment by AMø of wt mice (left) and AMø of miR-34a +/− mice (right) (1000x final magnification). D. Phagocytic index, as mean ± SEM from n=4–7 mice from 2–4 independent experiments per cell type; *, p<0.05; **, p<0.01 by Student t test.

