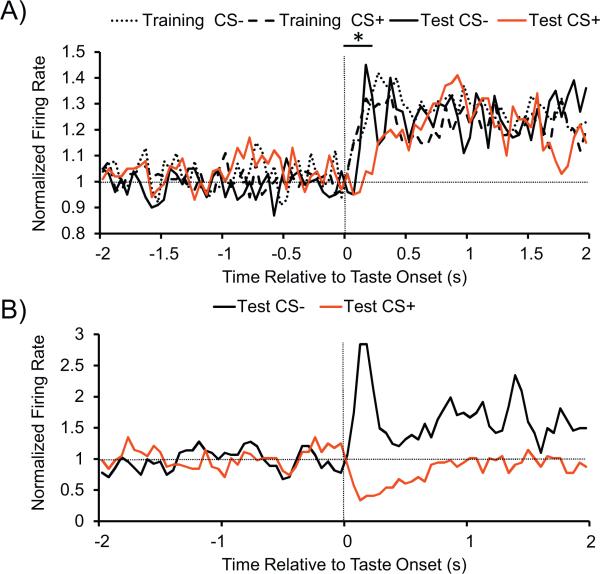
Figure 2.
A) The average normalized firing rates (horizontal line indicates baseline rate) up to 2 s before and after taste onset, which is centered at time 0 and indicated by the vertical line. There were significant rate difference between the CS+ after aversion conditioning and the three ‘liked’ tastes (CS− before and after conditioning, CS+ before conditioning) in the 0-250 ms epoch after taste onset (*p < 0.05). There were no statistically significant rate differences between tastes beyond the first 250 ms after taste onset. B) Example perievent time histogram for a unit which showed opposing responses to the ‘liked’ sweet CS− taste and ‘disliked’ CS+ sweet taste. Plots show unit activity up to 2 s before and after taste onset, which is centered at time 0 and indicated by the vertical line. Gaussian Smoothed Histograms (bin width = 50 ms) show the average firing rate across all trials.

