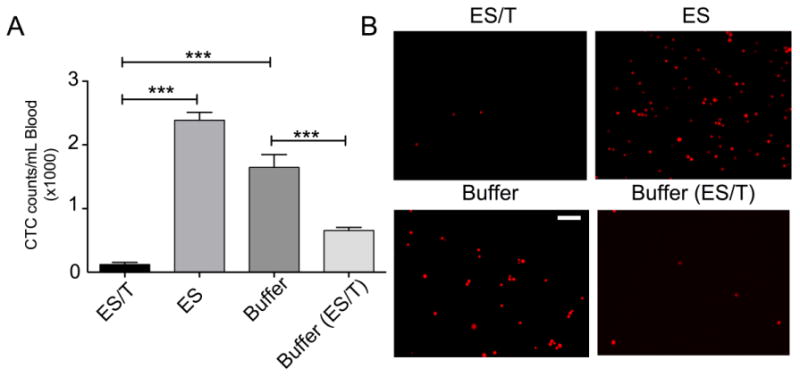
Fig 4. ES/TRAIL liposome treatment is effective in significantly reducing the number of circulating tumor cells in blood.

(A) Average number of CTCs in the peripheral circulation post treatment. n=3 mice for each group. Bars represent mean ± SD for each group. (B) Representative fluorescent micrographs showing mCherry positive DU145 cells isolated from whole blood of animals from different treatment groups at the end of the study. Scale bar = 100μm. n= 6, 6, 6, and 3 for treatment groups ES/T, ES, Buffer, Buffer(ES/T), respectively. Error bars represent the mean ± SD in each group. ***p<0.0001
