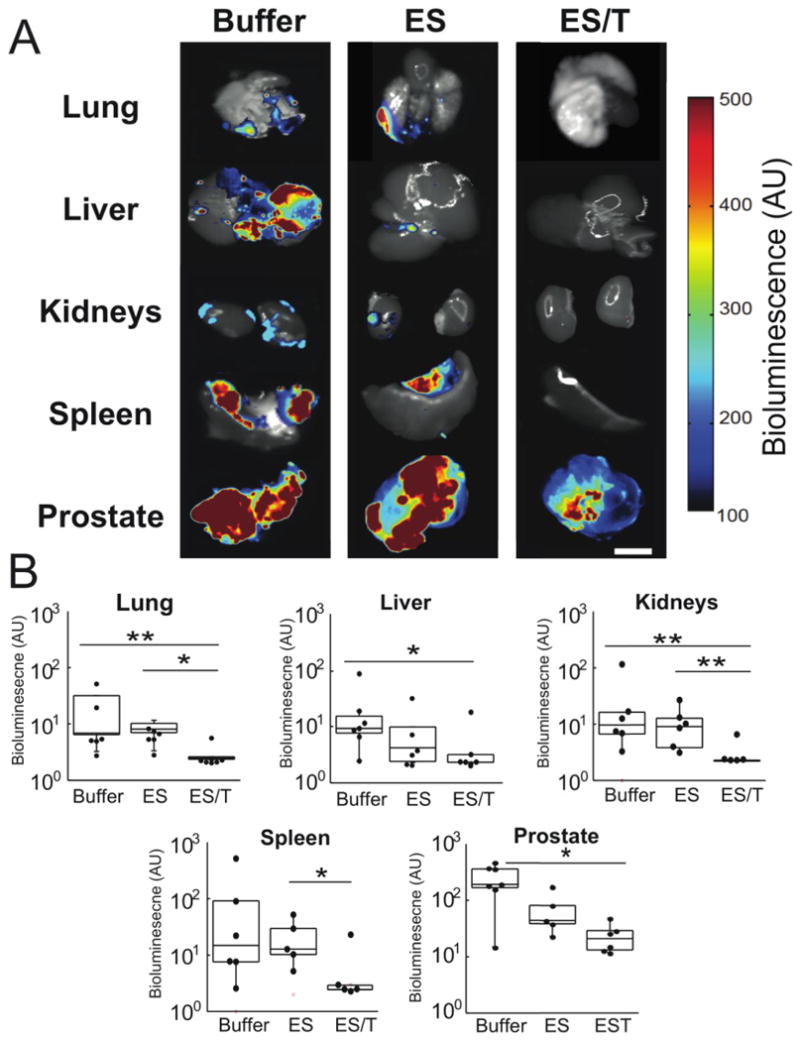
Fig 5. Ex vivo BLI analysis reveals that ES/TRAIL liposomes block widespread metastasis.

(A) Representative BLI images reveal the spread of DU145-Luc cells to lung, liver, kidney and spleen across Buffer, ES, and ES/T treatment groups (left-to-right). Scale bar=1cm. (B) Bioluminescent signal from each organ was quantified for each treatment groups: Buffer (n=8), ES-liposomes (n=6), and ES/T (n=6). Data are plotted on a log scale. Individual data points represent total organ signal from an individual animal. Superimposed box plots bound the 25th to 75th percentage of all data points and the whiskers extend 1.5 times the interquartile range beyond boxes. *P<0.05, **P<0.01 (one-way ANOVA with Tukey posttest).
