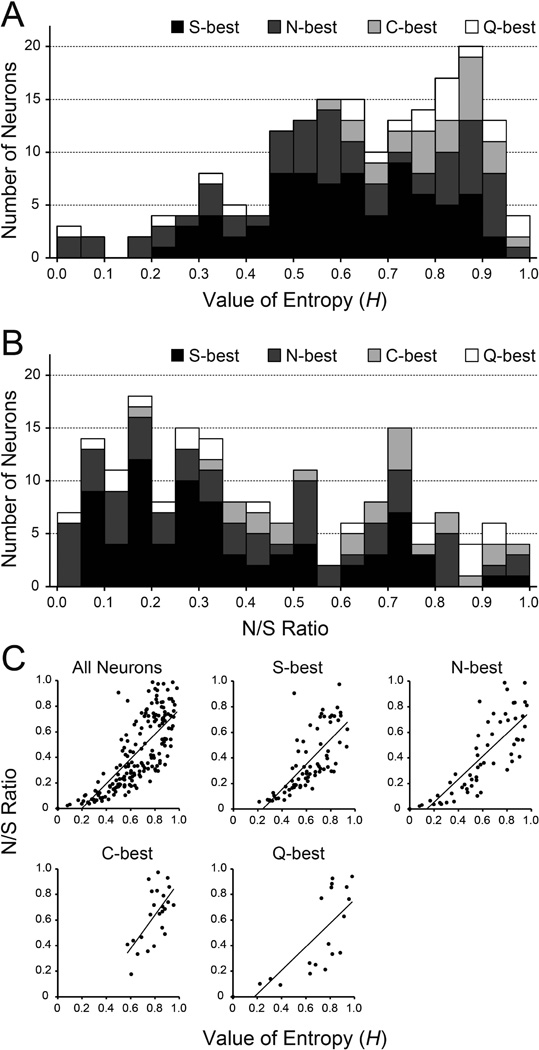
Figure 2.
A: Distribution of entropy values (H) of all 178 neurons categorized based on their best stimulus (range: 0.0 to 0.98). B: Distribution of noise-to-signal (N/S) ratio of all 178 neurons categorized based on their best stimulus (range: 0.0 to 0.98). C: Correlation between H and N/S ratio. Correlation coefficients for all neuron types, S-best, N-best, C-best and Q-best neurons were 0.78, 0.73, 0.82, 0.65 and 0.75, respectively.

