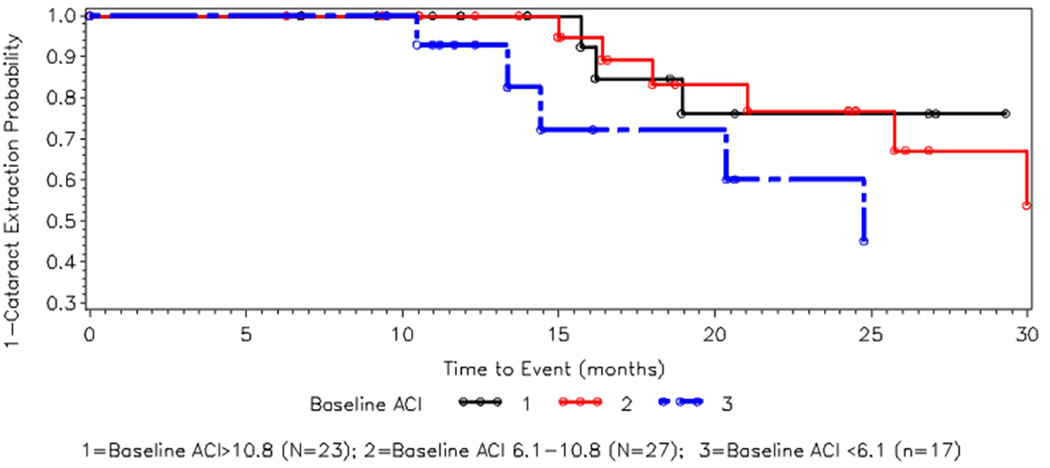
Figure 2. Kaplan – Meier curve for cataract surgery by baseline ACI.
Kaplan-Meier curve for cumulative risk for cataract surgery. Eyes were divided into 3 groups (tertiles) based on baseline ACI. The x axis shows time since baseline in months. The Y axis shows 1-cumulative probability of cataract surgery (i.e., the chance of not having cataract surgery). Those with lowest ACI (blue broken line) at baseline had highest risk for cataract surgery; those with higher ACI had lower risks for cataract surgery. The open circles indicate censored observation.

