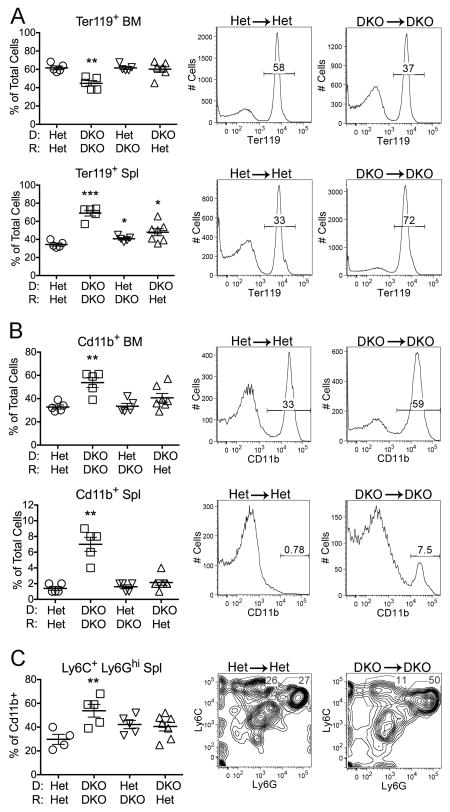
Figure 3. Extramedullary hematopoiesis and myeloid cell expansion depend on DNase II deficiency in both donor-derived hematopoietic and radioresistant host cells.
A) Percentage of total bone marrow (BM) and spleen (Spl) cell suspensions expressing the erythroid lineage marker Ter119. B) Percentage of total bone marrow and spleen cell suspensions expressing the myeloid lineage marker CD11b. C) Percentage of CD11b+ cells expressing the granulocyte phenotype Ly6C+ Ly6Ghi. Representative FACS plots for Het→Het and DKO→DKO are shown to the right of the compiled data figures in A, B, and C. Data is representative of 2 individual experiments. Values are the mean ± SEM; *=p<0.05, **=p<0.01, ***=p<0.001 compared to Het→Het.

