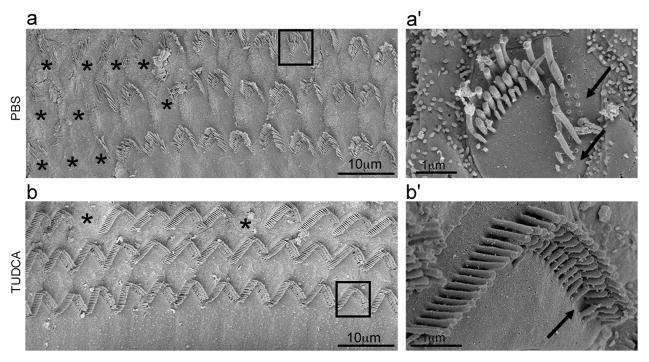
Fig. 4.
OHC morphology and subcellular structures detected by SEM at 9 weeks of age. The PBS-treated mouse showed greater OHC and stereocilia loss in the apical turn (a), while the TUDCA-treated mouse showed very minimal OHC loss even in the basal turn (b). The high-magnification images showed single-OHC subcellular structures in the square boxes in (a) and (b). The PBS-treated mouse exhibited evident disruption and several lack of stereocilia (a′). The TUDCA-treated mouse showed neatly arranged rows and occasional loss of stereocilia (b′). Stars and arrows indicate stereocilia loss.

