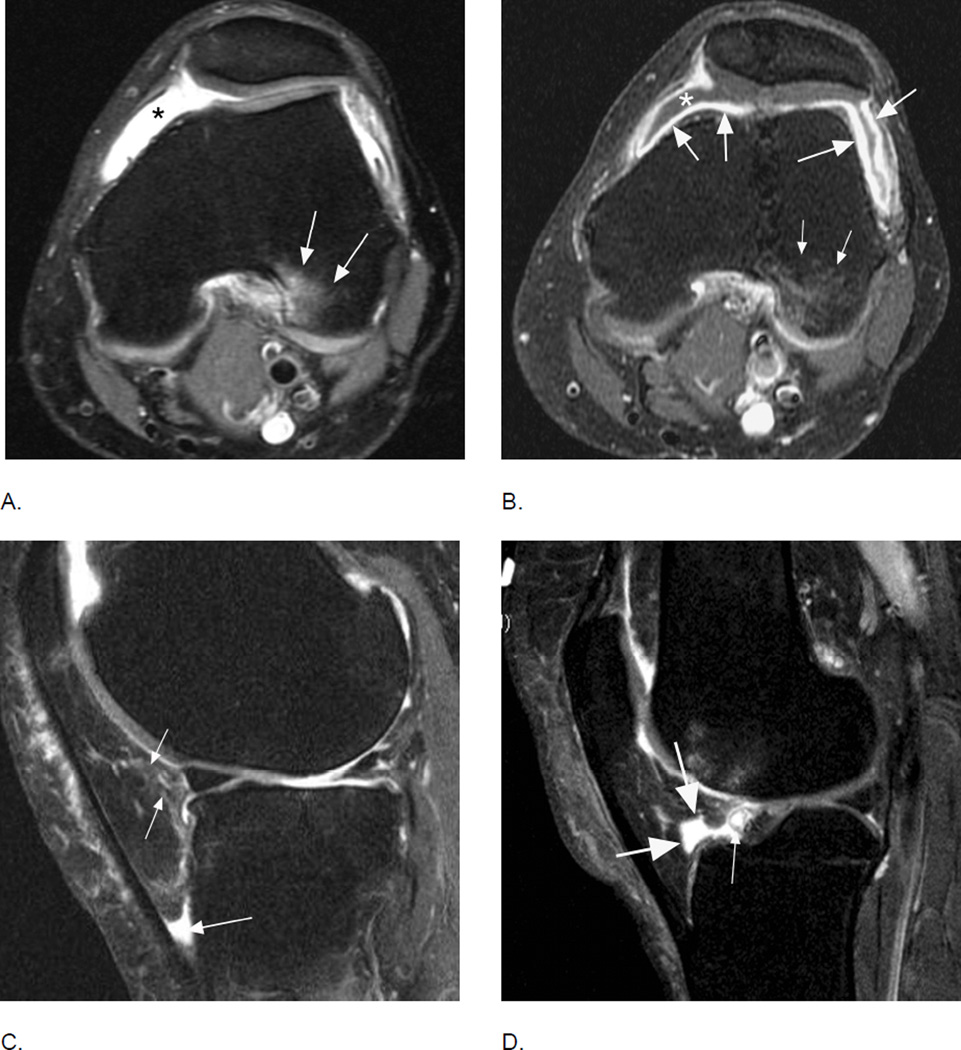
Figure 20.
Comparison of inflammatory manifestations of disease using non-enhanced and contrast-enhanced sequences. A. Axial intermediate-weighted fat-suppressed MRI shows homogeneous hyperintensity within the joint cavity consistent with grade 2 effusion-synovitis by MOAKS and WORMS (asterisk). Note BML in the posterior lateral femoral condyle consistent with traction edema at the insertion of the anterior cruciate ligament (arrows). B. Corresponding T1-weighted fat-suppressed image after intravenous contrast administration clearly differentiates between intraarticular joint fluid depicted as hypointensity (asterisk) and true synovial thickening visualized as hyperintense contrast enhancement of the synovial membrane (large arrows). Note that BMLs are similarly depicted on T2-weighted fat-suppressed and T1-weighted contrast-enhanced fat-suppressed MRI (small arrows). C. Sagittal fat-suppressed proton density-weighted MRI shows a grade 1 hyperintensity in Hoffa’s fat pad (small arrows). In addition there is fluid-equivalent joint fluid in the deep infrapatellar bursa (large arrow) consistent with bursitis. Hoffa’s fat pad pathology is common and several differential diagnoses have to be considered to correctly interpret imaging findings. D. Example of physiologic cleft in Hoffa’s fat pad, which communicates with the intraarticular cavity (large arrows). Clefts are common and must not be mistaken for cystic lesions36. Clefts should be excluded whenever applying segmentation approaches to quantify Hoffa’s volume. In addition there is a small Hoffa-cyst likely originating from the anterior horn of the lateral meniscus not to be mistaken as being part of the cleft (thin arrow).

