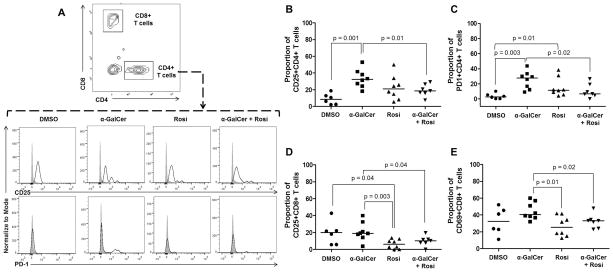
Figure 4. Administration of α-GalCer induces activation of CD4+ T cells in myometrial tissues that is reduced by rosiglitazone.
(A) Gating strategy used to identify activated CD4+ T cells (CD3+CD4+ cells) in myometrial tissues. Immunophenotyping of activation markers CD25 and PD1 in CD4+ T cells in myometrial tissues from mice injected with DMSO, α-GalCer, rosiglitazone (Rosi), or α-GalCer + rosiglitazone. The gray histogram represents the autofluorescence control, and the white histogram represents the fluorescence signal from CD4+ T cells. (B&C) Proportion of CD25+CD4+ T cells and PD1+CD4+ T cells in myometrial tissues from mice injected with DMSO, α-GalCer, rosiglitazone, or α-GalCer + rosiglitazone. Data are from individual dams, n=6–8 each. (D&E) Proportion of CD25+CD8+ T cells and CD69+CD8+ T cells in myometrial tissues from mice injected with DMSO, α-GalCer, rosiglitazone, or α-GalCer + rosiglitazone. Data are from individual dams, n=6–8 each.

