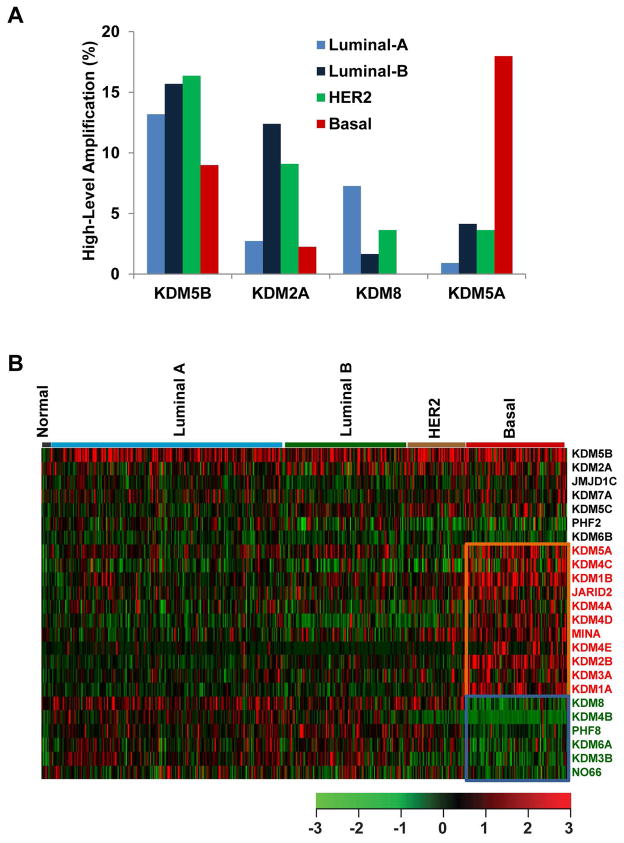
Figure 1.
Copy number and expression levels of KDMs in breast cancer. (A) Frequencies of high-level amplification of KDM2A, KDM5A, KDM5B, and KDM8 in Luminal A, Luminal B, HER2+ and basal-like breast cancers, based on TCGA database. (B) Heatmap of KDM expression profiles in different types of breast cancer. Genes with significantly higher expression (p<0.001) in basal-like tumors are highlighted in red, and genes with lower expression (p<0.001) in basal-like tumors are indicated with green.

