Figure 3.
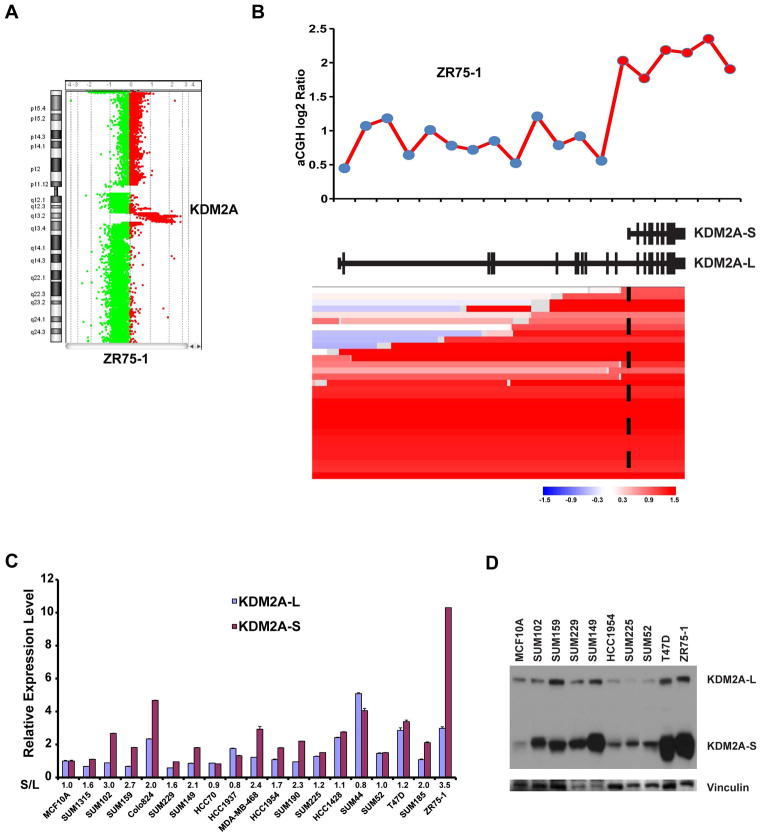
Amplification and overexpression of KDM2A isoforms in breast cancer. (A) Genomic view of chromosome 11 analyzed using the Agilent oligonucleotide array (Agilent Technologies, Santa Clara, CA) in ZR75-1 cells. (B) Top: Genome plot of the KDM2A region in the array-CGH data of ZR75-1 breast cancer cells. The X-axis identifies genomic position, and Y-axis is the log2 ratio for each Agilent probe. Bottom: Heatmap of segmented copy number data of TCGA breast cancer samples, which contains the amplification of the KDM2A short isoform. The genomic structure of both the long and short isoforms of KDM2A was based on the NCBI database (middle). (C) mRNA expression levels of the short and long isoforms of KDM2A, measured by qRT-PCR, in a panel of 18 breast cancer cell lines. mRNA expression levels in MCF10A cells, an immortalized but nontumorigenic breast epithelial cell line, were arbitrarily set as 1. Relative expression levels are shown as fold changes compared with that in MCF10A cells. The relative ratio (S/L = short/long) is shown at the bottom. Data are expressed as mean ± SD. (D) Protein level of long and short isoforms of KDM2A was analyzed by western blot in nine breast cancer cell lines and the MCF10A line. Vinculin was used as the loading control. L=long isoform; S=short isoform.

