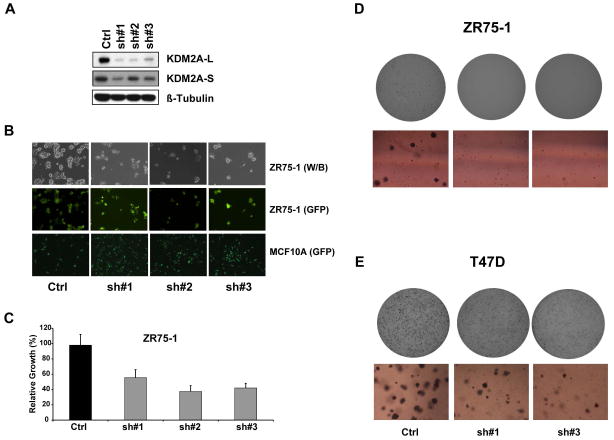
Figure 4.
Effect of KDM2A knockdown on growth and transforming phenotypes of breast cancer cells. (A) Knockdown of KDM2A in ZR75-1 cells with three different shRNAs was confirmed by western blot. Beta-tubulin was used as the loading control. (B) Top row shows black and white images and middle row shows TurboGFP images of ZR75-1 cells after viral infection with control shRNA and KDM2A shRNA#1, #2, and #3. Bottom row shows TurboGFP images of MCF10A cells with or without KDM2A knockdown. In the pGIPZ shRNA vector, TurboGFP and shRNA are part of a bicistronic transcript that allows the visual marking of shRNA-expressing cells. (C) Bar graph shows relative cell growth after knocking down KDM2A in ZR75-1 breast cancer cells (p<0.05). Data are expressed as mean ± SD. Effects of KDM2A knockdown on anchorage-independent growth of (D) ZR75-1 and (E) T47D breast cancer cells. Top, representative images of one whole plate with the Oxford Optronix counter. Bottom, optical sections of representative colonies (also see Supplementary Figure S7A and B).

