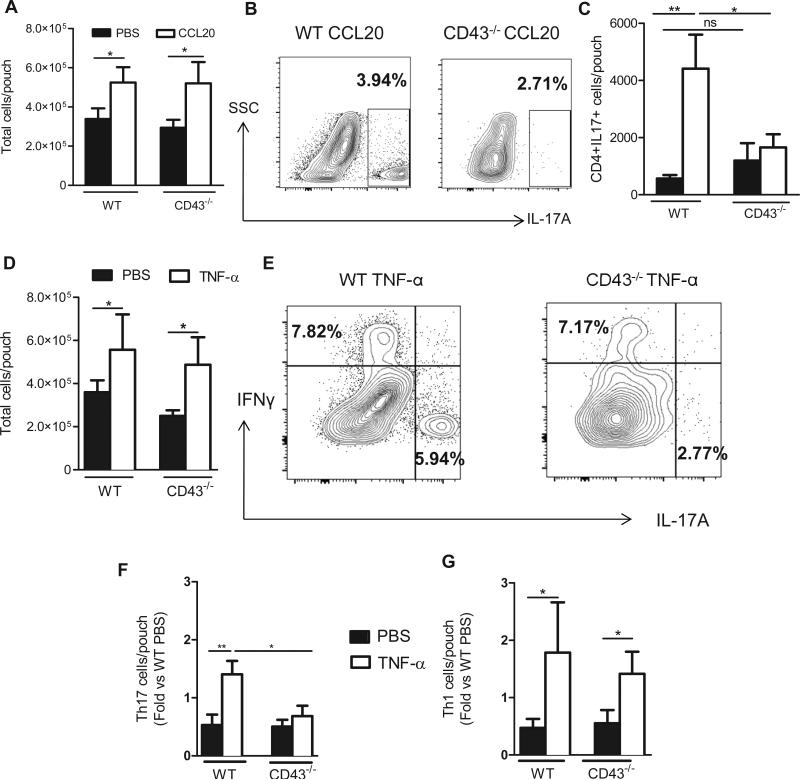
Figure 4. CD43−/− mice show impaired recruitment of Th17 cells in response to CCL20 and TNF-α in vivo.
A-G. The indicated mice (5 per group in three independent experiments) received PBS or 400ng of CCL20 or TNF-α (4- 7 mice per group in three independent experiments) into the air pouch, and recruited cells were harvested 24h post injection and analyzed by cell counting (A, D) and flow cytometry (B, C, E-G). Representative dot plots indicate IL-17A and/or IFNγ staining in CCL20 (B) or TNF-α (E) air pouches. C. The number of Th17 cells in the PBS or CCL20 injected air pouch was calculated based on the percent CD4+ cells referred to the total number of cells harvested per air pouch. The number of Th17 cells (F) and Th1 cells (G) infiltrated in response to PBS or TNF-α in each mouse was divided by the average number of Th17 or Th1 cells infiltrated in the PBS mice, for WT and CD43−/− groups, and in each of the 3 independent experiments performed. The values of each experiment were averaged to determine the Fold vs PBS.*p<0.05**p<0.01, ns = not significant.

