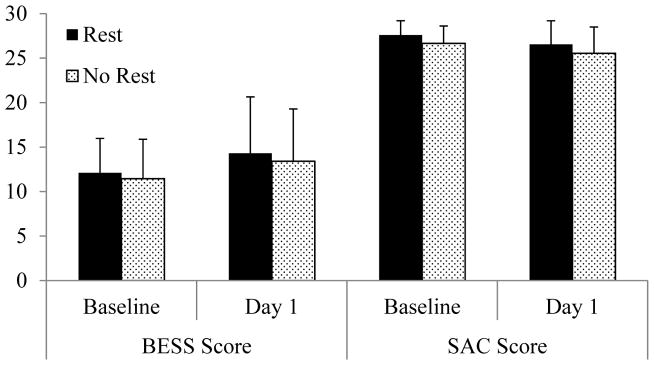
Figure 1. SAC and BESS Scores at Baseline and Day 1 Post–Injury.
For the BESS, there were no differences between Rest and No-Rest groups at Baseline (12.1 ± 3.9 errors and 11.5 ± 4.4 errors respectively, P=0.578), on Day 1 (14.3 ± 6.3 errors and 13.4 ± 5.9 errors respectively, P=0.608), or the change from Baseline to Day 1 (2.2 ± 5.8 errors and 2.0 ± 5.6 errors respectively, P=0.883). For the SAC, there were no differences between Rest and No-Rest groups at Baseline (27.6 ± 1.6 errors and 26.7 ± 1.9 errors respectively, P=0.073), on Day 1 (26.6 ± 2.6 errors and 25.5 ± 3.0 errors respectively, P=0.209), or the change from Baseline to Day 1 (1.0 ± 2.8 errors and 1.1 ± 3.1 errors respectively, P=0.920).

