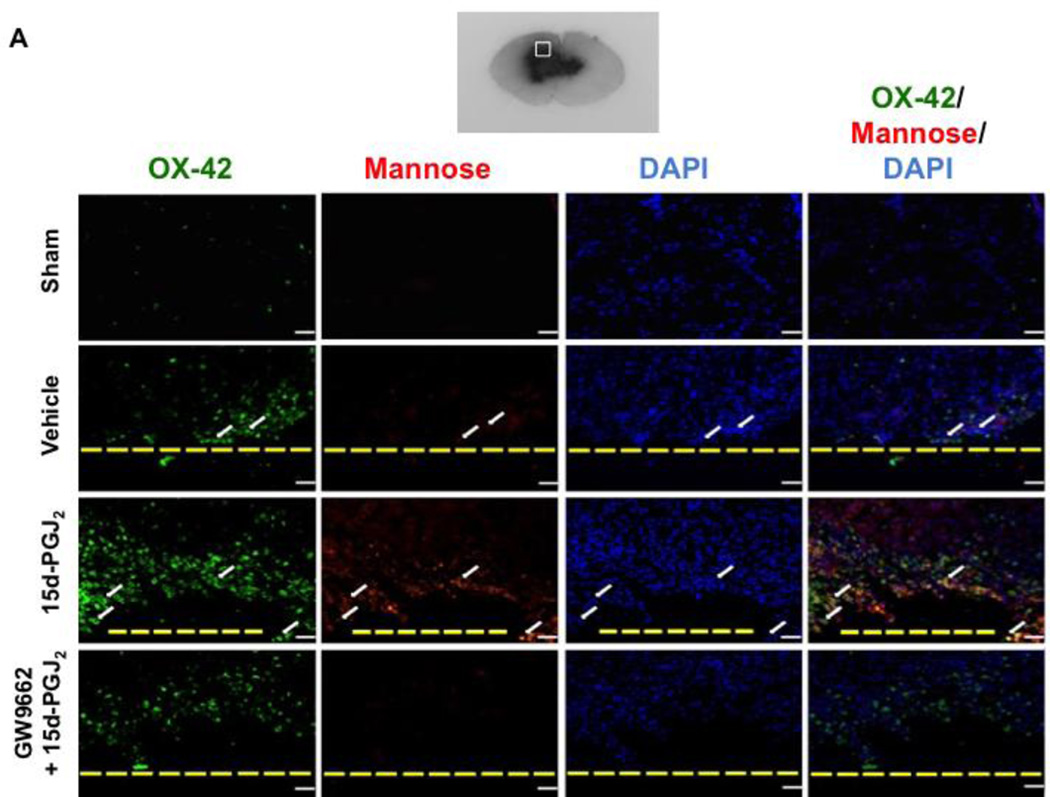
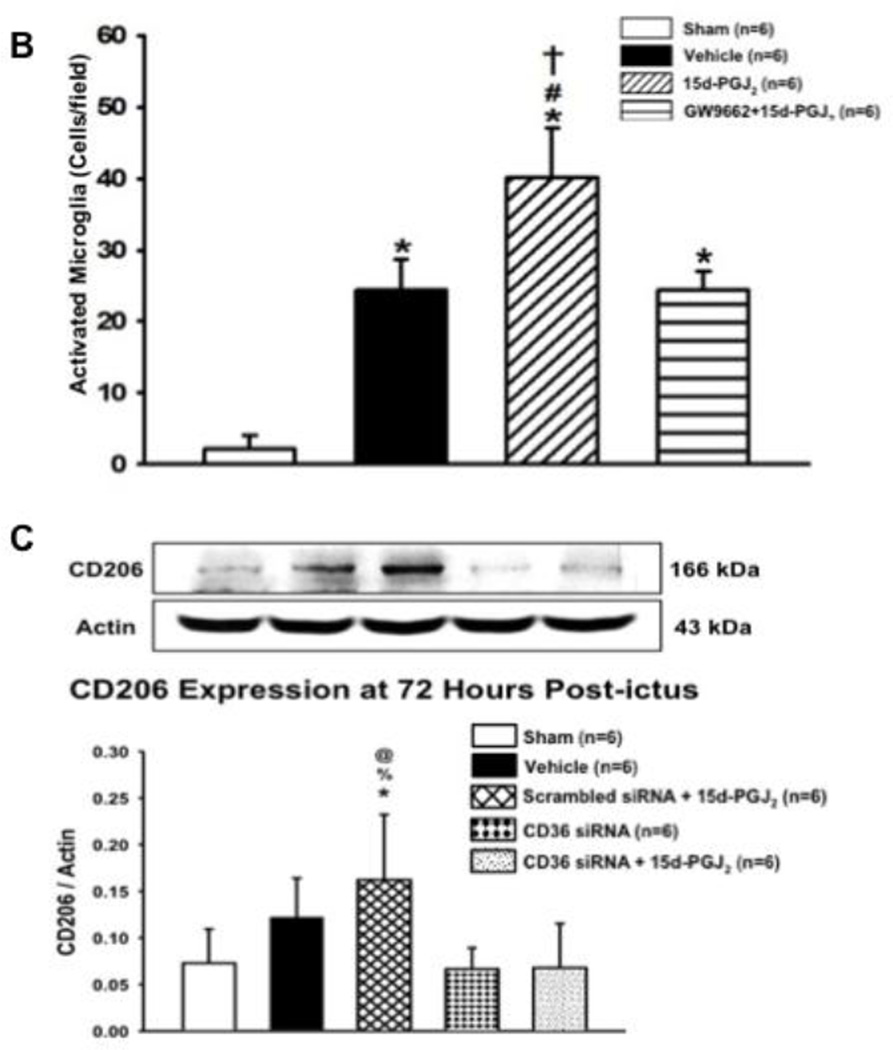
Figure 5.
Immunohistochemistry representative pictures were taken showing the co-localization of (A) activated microglia (OX-42; scale bar: 20 µm) with Mannose Receptor and DAPI staining and (B) quantification of activated microglia was conducted at 72 hours. Western blots were conducted at 72 hours for (C) CD206 Expression. Note: peri-hematoma region is below the yellow broken line (A) and the representative GMH brain indicates where IHC images were taken. Values are expressed as mean±SD. *P<0.05 compared with sham, #P<0.05 compared with vehicle, †P<0.05 compared with inhibitor and agonist, %P<0.05 compared CD 36 siRNA, and @P<0.05 compared to scrambled siRNA. N=6 per group; and ICH, Immunohistochemistry. N=6 per group.


