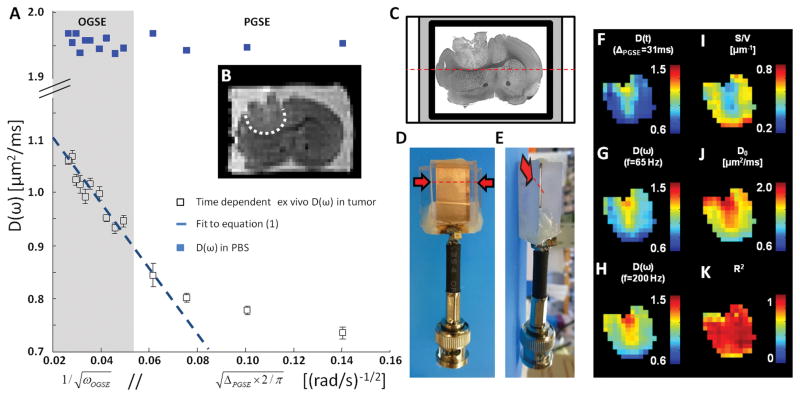
Figure 3. Representative ex vivo data.
A. Time-dependence of the average ex vivo D(ω) in glioma (white open squares) and PBS ROI (blue closed squares) versus inverse square-root of oscillation frequency (OGSE, gray box) // square-root of diffusion time (PGSE, white). Error bars represent standard deviations within the ROI. This time dependence becomes asymptotically linear in the high-frequency limit (OGSE). B. T2-weighted SE-EPI (b=0) showing the tumor location (white ROI) inside the brain C. An ex vivo sample (thickness = 0.1 mm) immersed in PBS (white) and sealed with Fomblin (gray) is inserted (along dashed red line/arrow) inside a dedicated MR histocoil (D/E, lateral/top view). F–H. Diffusion maps of GL261 obtained at various diffusion times (F. ΔPGSE = 31 ms) and oscillation frequencies (G/H, fOGSE = 65/200 Hz). I–J. Parametric maps of S/V (I) and free diffusivity D0 (J) inside the tumor. K. Parametric mapping of the coefficient of determination R2 shows how well Eq. [1] fits to the ex vivo OGSE data.

