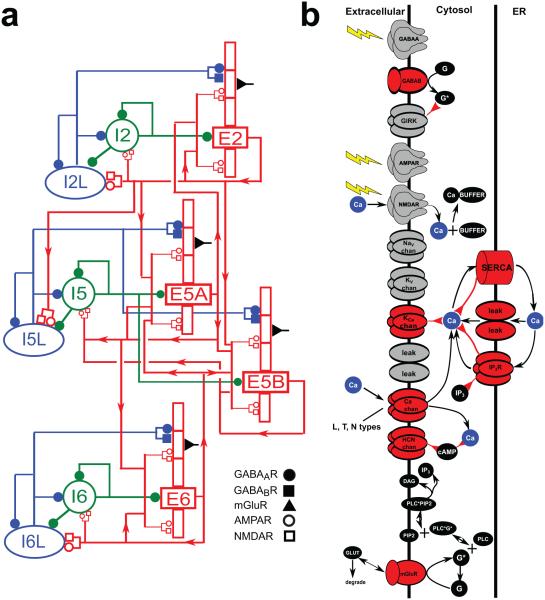
Figure 1. Model schematics.
(A) Schematic of neocortical network architecture. Red rectangles represent populations of 5-compartment excitatory cells (largest rectangle represents soma, 3 apical-dendrite compartments point upward, basal dendrite compartment points downward); green circles represent fast-spiking interneurons; blue ellipses represent low-threshold firing interneurons. Lines (with arrows) indicate connections between the populations. E cells synapse with AMPAR/NMDARs; I cells synapse with GABAAR / GABABRs. Filled circles represent GABAAR / GABABRs. Open circles and rectangles represent AMPAR/NMDARs. (B) Schematic of chemical signaling in pyramidal cells showing fluxes (black arrows) and second- (and third- etc) messenger modulation (red back-beginning arrows). We distinguish membrane-associated ionotropic and metabotropic receptors and ion channels involved in reaction schemes in red (in reality, it is likely that almost every membrane-bound protein is modulated). External events are represented by yellow lightning bolts – there is no extracellular diffusion; the only extracellular reaction is glutamate binding, unbinding and degradation on mGluR1 after an event. Ca2+ is shown redundantly in blue – note that there is only one Ca2+ pool for extracellular, 1 pool for cytoplasmic, and 1 pool for ER. (PLC: phospholipase C, DAg: diacyl-glycerol, cAMP: cyclic adenosine monophosphate; PIP2: phosphatidylinositol 4,5-bisphosphate).

