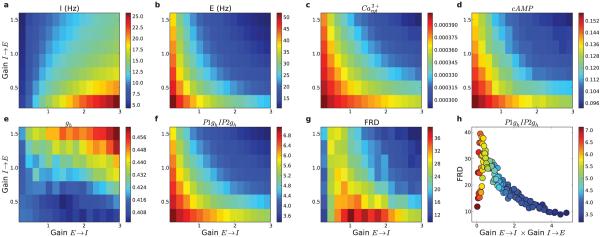
Figure 10. Modulating E→I (15 levels) and I→E (8 levels) synaptic weights shapes firing rates and intracellular molecular activations.
(a) Interneuron and (b) excitatory neuron firing rates after stimulation. (c) Peak cytosolic calcium (mM) in stimulated excitatory cells. (d) cAMP and (e) gh of stimulated E cells. (f) Stimulated to non-stimulated gh ratio. (g) FRD (firing-rate distinction). (h) FRD as a function of network inhibition estimated by E→ I×I→ E (16 s simulations; color indicates average ratio of gh in stimulated P1 vs non-stimulated P2 populations).

