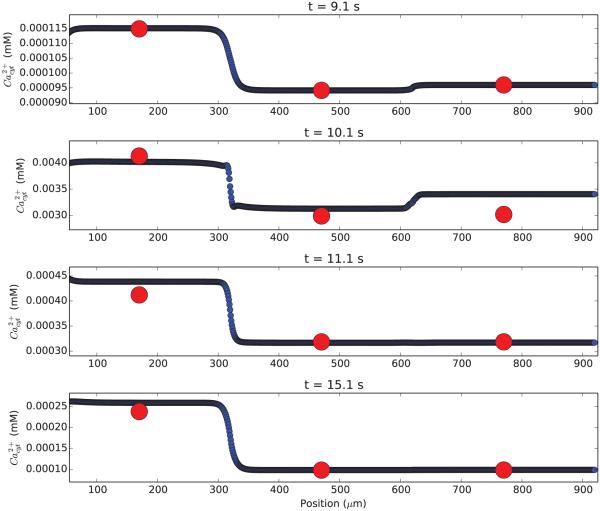
Figure 2. Simulation of a single neuron with high (blue; 1 μm) and low (red; 300 μm) spatial resolution shows similar calcium concentrations.
Calcium concentration is displayed as a function of position along the apical dendrite at four different times in the simulation (time from top to bottom). Excitatory stimulus at 10 s admits Ca2+ into the cytosol.

