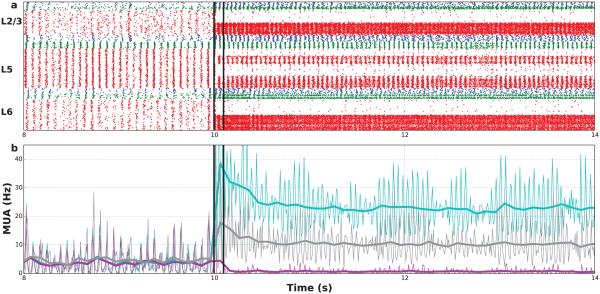
Figure 5. Network persistent activity after stimulating 50% of E-cells.
(a) Raster plot of spike times (red: PYR, blue: LTS, green: FS cells) (b) Multiunit activity (MUA; thick: 100 ms bin; thin: 10 ms bin) for stimulated E neurons (light-blue), non-stimulated E neurons (purple), interneurons (gray). (Stimulation added to background activation between black lines: 180× weight 500 Hz Poisson process.)

