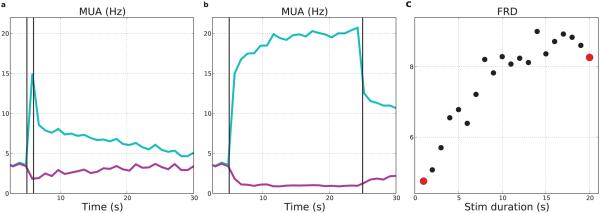
Figure 8. Longer-duration weak stimulation produces firing-rate distinctions.
Stimuli were 0.1× baseline strength used in other figures. (a) MUAs in response to 1 s stimulus. (b) MUAs in response to 20 s stimulus. (c) FRD in response to 1–20 s stimulus durations (red dots from (a), (b)) (50% E cells all layers; MUAs with 1000 ms bins of stimulated: light-blue; non-stimulated: purple)

